Alaska Native vs Spanish Unemployment Among Seniors over 75 years
COMPARE
Alaska Native
Spanish
Unemployment Among Seniors over 75 years
Unemployment Among Seniors over 75 years Comparison
Alaska Natives
Spanish
14.7%
UNEMPLOYMENT AMONG SENIORS OVER 75 YEARS
0.0/ 100
METRIC RATING
343rd/ 347
METRIC RANK
9.1%
UNEMPLOYMENT AMONG SENIORS OVER 75 YEARS
3.3/ 100
METRIC RATING
240th/ 347
METRIC RANK
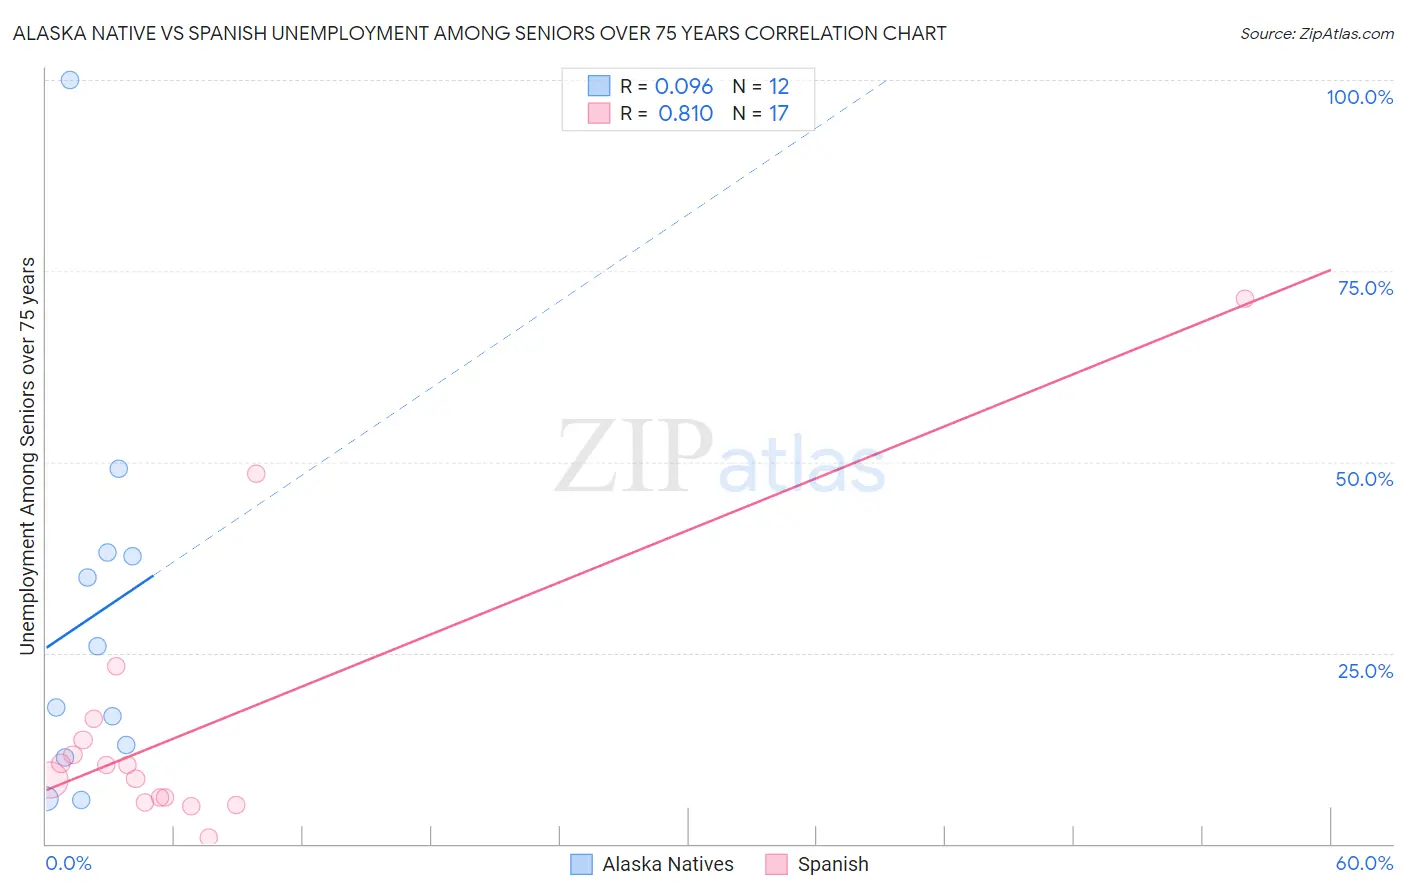
Alaska Native vs Spanish Unemployment Among Seniors over 75 years Correlation Chart
The statistical analysis conducted on geographies consisting of 61,103,745 people shows a slight positive correlation between the proportion of Alaska Natives and unemployment rate among seniors over the age of 75 in the United States with a correlation coefficient (R) of 0.096 and weighted average of 14.7%. Similarly, the statistical analysis conducted on geographies consisting of 210,206,021 people shows a very strong positive correlation between the proportion of Spanish and unemployment rate among seniors over the age of 75 in the United States with a correlation coefficient (R) of 0.810 and weighted average of 9.1%, a difference of 60.4%.
Unemployment Among Seniors over 75 years Correlation Summary
| Measurement | Alaska Native | Spanish |
| Minimum | 5.8% | 0.90% |
| Maximum | 100.0% | 71.4% |
| Range | 94.2% | 70.5% |
| Mean | 29.7% | 15.4% |
| Median | 21.8% | 10.3% |
| Interquartile 25% (IQ1) | 12.1% | 5.7% |
| Interquartile 75% (IQ3) | 37.9% | 15.0% |
| Interquartile Range (IQR) | 25.8% | 9.3% |
| Standard Deviation (Sample) | 26.2% | 18.0% |
| Standard Deviation (Population) | 25.1% | 17.5% |
Similar Demographics by Unemployment Among Seniors over 75 years
Demographics Similar to Alaska Natives by Unemployment Among Seniors over 75 years
In terms of unemployment among seniors over 75 years, the demographic groups most similar to Alaska Natives are Hmong (13.7%, a difference of 6.8%), Lumbee (13.5%, a difference of 8.9%), Immigrants from Yemen (16.5%, a difference of 12.4%), Yup'ik (12.8%, a difference of 14.9%), and Cajun (12.5%, a difference of 17.4%).
| Demographics | Rating | Rank | Unemployment Among Seniors over 75 years |
| Alaskan Athabascans | 0.0 /100 | #333 | Tragic 11.0% |
| Assyrians/Chaldeans/Syriacs | 0.0 /100 | #334 | Tragic 11.1% |
| French Canadians | 0.0 /100 | #335 | Tragic 11.2% |
| Immigrants | North Macedonia | 0.0 /100 | #336 | Tragic 11.3% |
| Cape Verdeans | 0.0 /100 | #337 | Tragic 11.4% |
| Immigrants | Cabo Verde | 0.0 /100 | #338 | Tragic 12.3% |
| Cajuns | 0.0 /100 | #339 | Tragic 12.5% |
| Yup'ik | 0.0 /100 | #340 | Tragic 12.8% |
| Lumbee | 0.0 /100 | #341 | Tragic 13.5% |
| Hmong | 0.0 /100 | #342 | Tragic 13.7% |
| Alaska Natives | 0.0 /100 | #343 | Tragic 14.7% |
| Immigrants | Yemen | 0.0 /100 | #344 | Tragic 16.5% |
| Yakama | 0.0 /100 | #345 | Tragic 18.4% |
| Tlingit-Haida | 0.0 /100 | #346 | Tragic 20.7% |
Demographics Similar to Spanish by Unemployment Among Seniors over 75 years
In terms of unemployment among seniors over 75 years, the demographic groups most similar to Spanish are Mexican (9.1%, a difference of 0.050%), Inupiat (9.1%, a difference of 0.10%), Houma (9.1%, a difference of 0.20%), Immigrants from Southern Europe (9.2%, a difference of 0.21%), and Sierra Leonean (9.2%, a difference of 0.23%).
| Demographics | Rating | Rank | Unemployment Among Seniors over 75 years |
| Yugoslavians | 4.8 /100 | #233 | Tragic 9.1% |
| Vietnamese | 4.6 /100 | #234 | Tragic 9.1% |
| Panamanians | 4.0 /100 | #235 | Tragic 9.1% |
| Jordanians | 4.0 /100 | #236 | Tragic 9.1% |
| Houma | 3.9 /100 | #237 | Tragic 9.1% |
| Inupiat | 3.6 /100 | #238 | Tragic 9.1% |
| Mexicans | 3.5 /100 | #239 | Tragic 9.1% |
| Spanish | 3.3 /100 | #240 | Tragic 9.1% |
| Immigrants | Southern Europe | 2.8 /100 | #241 | Tragic 9.2% |
| Sierra Leoneans | 2.8 /100 | #242 | Tragic 9.2% |
| Slavs | 2.8 /100 | #243 | Tragic 9.2% |
| Immigrants | Germany | 2.7 /100 | #244 | Tragic 9.2% |
| Immigrants | Canada | 2.6 /100 | #245 | Tragic 9.2% |
| Immigrants | North America | 2.4 /100 | #246 | Tragic 9.2% |
| Sub-Saharan Africans | 2.3 /100 | #247 | Tragic 9.2% |