African vs Tongan Unemployment Among Ages 25 to 29 years
COMPARE
African
Tongan
Unemployment Among Ages 25 to 29 years
Unemployment Among Ages 25 to 29 years Comparison
Africans
Tongans
7.6%
UNEMPLOYMENT AMONG AGES 25 TO 29 YEARS
0.0/ 100
METRIC RATING
288th/ 347
METRIC RANK
5.5%
UNEMPLOYMENT AMONG AGES 25 TO 29 YEARS
100.0/ 100
METRIC RATING
2nd/ 347
METRIC RANK
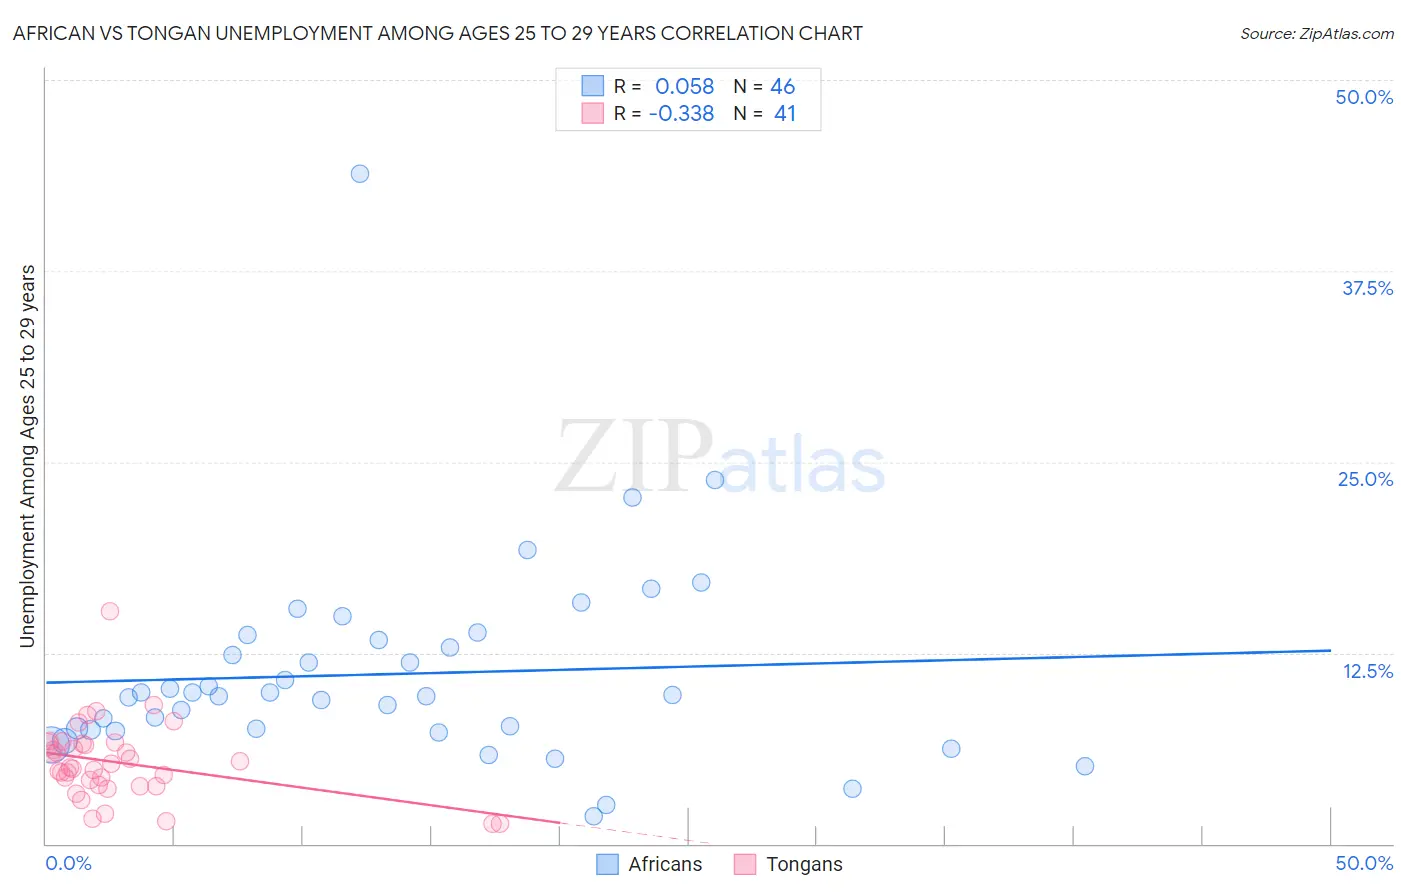
African vs Tongan Unemployment Among Ages 25 to 29 years Correlation Chart
The statistical analysis conducted on geographies consisting of 443,131,541 people shows a slight positive correlation between the proportion of Africans and unemployment rate among population between the ages 25 and 29 in the United States with a correlation coefficient (R) of 0.058 and weighted average of 7.6%. Similarly, the statistical analysis conducted on geographies consisting of 101,173,366 people shows a mild negative correlation between the proportion of Tongans and unemployment rate among population between the ages 25 and 29 in the United States with a correlation coefficient (R) of -0.338 and weighted average of 5.5%, a difference of 38.5%.
Unemployment Among Ages 25 to 29 years Correlation Summary
| Measurement | African | Tongan |
| Minimum | 1.8% | 1.3% |
| Maximum | 43.9% | 15.2% |
| Range | 42.1% | 13.9% |
| Mean | 11.1% | 5.3% |
| Median | 9.7% | 5.0% |
| Interquartile 25% (IQ1) | 7.5% | 3.8% |
| Interquartile 75% (IQ3) | 13.3% | 6.5% |
| Interquartile Range (IQR) | 5.8% | 2.7% |
| Standard Deviation (Sample) | 6.8% | 2.5% |
| Standard Deviation (Population) | 6.7% | 2.5% |
Similar Demographics by Unemployment Among Ages 25 to 29 years
Demographics Similar to Africans by Unemployment Among Ages 25 to 29 years
In terms of unemployment among ages 25 to 29 years, the demographic groups most similar to Africans are Immigrants from Mexico (7.6%, a difference of 0.060%), Vietnamese (7.6%, a difference of 0.65%), Belizean (7.7%, a difference of 0.71%), Senegalese (7.6%, a difference of 0.74%), and Armenian (7.7%, a difference of 0.81%).
| Demographics | Rating | Rank | Unemployment Among Ages 25 to 29 years |
| Immigrants | Bangladesh | 0.0 /100 | #281 | Tragic 7.5% |
| Immigrants | Senegal | 0.0 /100 | #282 | Tragic 7.6% |
| Creek | 0.0 /100 | #283 | Tragic 7.6% |
| Cherokee | 0.0 /100 | #284 | Tragic 7.6% |
| Senegalese | 0.0 /100 | #285 | Tragic 7.6% |
| Vietnamese | 0.0 /100 | #286 | Tragic 7.6% |
| Immigrants | Mexico | 0.0 /100 | #287 | Tragic 7.6% |
| Africans | 0.0 /100 | #288 | Tragic 7.6% |
| Belizeans | 0.0 /100 | #289 | Tragic 7.7% |
| Armenians | 0.0 /100 | #290 | Tragic 7.7% |
| Hispanics or Latinos | 0.0 /100 | #291 | Tragic 7.7% |
| Chippewa | 0.0 /100 | #292 | Tragic 7.8% |
| Immigrants | Belize | 0.0 /100 | #293 | Tragic 7.8% |
| Trinidadians and Tobagonians | 0.0 /100 | #294 | Tragic 7.8% |
| Comanche | 0.0 /100 | #295 | Tragic 7.8% |
Demographics Similar to Tongans by Unemployment Among Ages 25 to 29 years
In terms of unemployment among ages 25 to 29 years, the demographic groups most similar to Tongans are Immigrants from Somalia (5.5%, a difference of 0.31%), Immigrants from Cuba (5.6%, a difference of 2.4%), Somali (5.6%, a difference of 2.4%), Sudanese (5.4%, a difference of 2.5%), and Hmong (5.7%, a difference of 2.6%).
| Demographics | Rating | Rank | Unemployment Among Ages 25 to 29 years |
| Sudanese | 100.0 /100 | #1 | Exceptional 5.4% |
| Tongans | 100.0 /100 | #2 | Exceptional 5.5% |
| Immigrants | Somalia | 100.0 /100 | #3 | Exceptional 5.5% |
| Immigrants | Cuba | 100.0 /100 | #4 | Exceptional 5.6% |
| Somalis | 100.0 /100 | #5 | Exceptional 5.6% |
| Hmong | 100.0 /100 | #6 | Exceptional 5.7% |
| Immigrants | India | 100.0 /100 | #7 | Exceptional 5.7% |
| Immigrants | Bosnia and Herzegovina | 100.0 /100 | #8 | Exceptional 5.7% |
| Immigrants | Nepal | 100.0 /100 | #9 | Exceptional 5.7% |
| Immigrants | Sudan | 100.0 /100 | #10 | Exceptional 5.8% |
| Cambodians | 100.0 /100 | #11 | Exceptional 5.8% |
| Okinawans | 100.0 /100 | #12 | Exceptional 5.9% |
| Immigrants | Bolivia | 100.0 /100 | #13 | Exceptional 5.9% |
| Immigrants | Kuwait | 99.9 /100 | #14 | Exceptional 5.9% |
| Cubans | 99.9 /100 | #15 | Exceptional 5.9% |