African vs Immigrants from Northern Europe Unemployment Among Ages 16 to 19 years
COMPARE
African
Immigrants from Northern Europe
Unemployment Among Ages 16 to 19 years
Unemployment Among Ages 16 to 19 years Comparison
Africans
Immigrants from Northern Europe
19.5%
UNEMPLOYMENT AMONG AGES 16 TO 19 YEARS
0.0/ 100
METRIC RATING
278th/ 347
METRIC RANK
17.4%
UNEMPLOYMENT AMONG AGES 16 TO 19 YEARS
72.5/ 100
METRIC RATING
150th/ 347
METRIC RANK
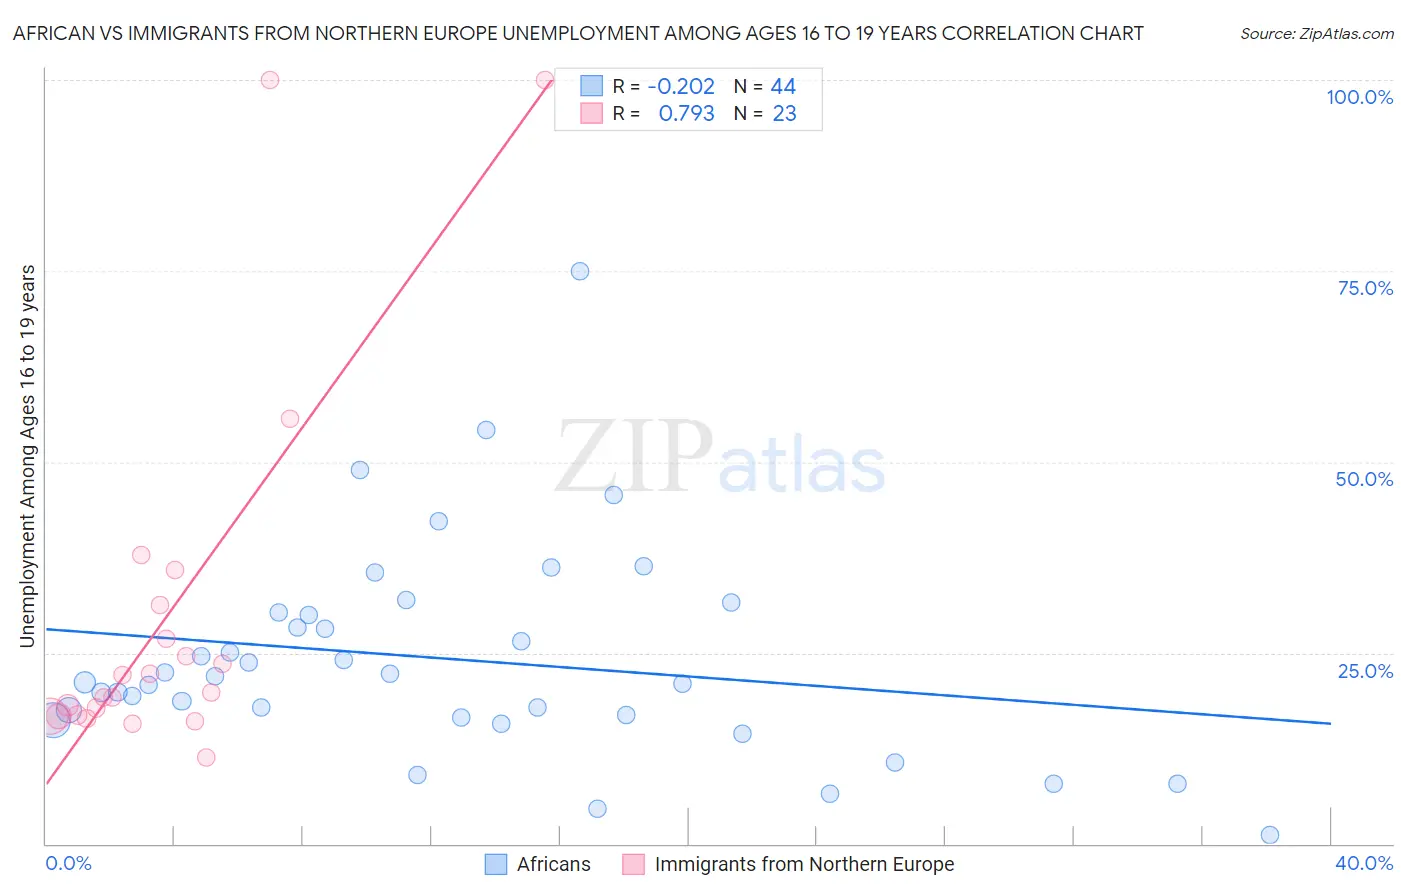
African vs Immigrants from Northern Europe Unemployment Among Ages 16 to 19 years Correlation Chart
The statistical analysis conducted on geographies consisting of 442,505,676 people shows a weak negative correlation between the proportion of Africans and unemployment rate among population between the ages 16 and 19 in the United States with a correlation coefficient (R) of -0.202 and weighted average of 19.5%. Similarly, the statistical analysis conducted on geographies consisting of 443,364,808 people shows a strong positive correlation between the proportion of Immigrants from Northern Europe and unemployment rate among population between the ages 16 and 19 in the United States with a correlation coefficient (R) of 0.793 and weighted average of 17.4%, a difference of 12.2%.
Unemployment Among Ages 16 to 19 years Correlation Summary
| Measurement | African | Immigrants from Northern Europe |
| Minimum | 1.2% | 11.4% |
| Maximum | 75.0% | 100.0% |
| Range | 73.8% | 88.6% |
| Mean | 24.2% | 29.7% |
| Median | 21.5% | 19.8% |
| Interquartile 25% (IQ1) | 16.7% | 16.8% |
| Interquartile 75% (IQ3) | 30.1% | 31.3% |
| Interquartile Range (IQR) | 13.4% | 14.6% |
| Standard Deviation (Sample) | 13.9% | 24.2% |
| Standard Deviation (Population) | 13.7% | 23.6% |
Similar Demographics by Unemployment Among Ages 16 to 19 years
Demographics Similar to Africans by Unemployment Among Ages 16 to 19 years
In terms of unemployment among ages 16 to 19 years, the demographic groups most similar to Africans are Immigrants from Western Africa (19.4%, a difference of 0.23%), Ute (19.6%, a difference of 0.37%), Cajun (19.6%, a difference of 0.49%), Immigrants from Latin America (19.4%, a difference of 0.56%), and Paraguayan (19.4%, a difference of 0.65%).
| Demographics | Rating | Rank | Unemployment Among Ages 16 to 19 years |
| Blackfeet | 0.0 /100 | #271 | Tragic 19.2% |
| Hispanics or Latinos | 0.0 /100 | #272 | Tragic 19.2% |
| Immigrants | Panama | 0.0 /100 | #273 | Tragic 19.3% |
| Shoshone | 0.0 /100 | #274 | Tragic 19.3% |
| Paraguayans | 0.0 /100 | #275 | Tragic 19.4% |
| Immigrants | Latin America | 0.0 /100 | #276 | Tragic 19.4% |
| Immigrants | Western Africa | 0.0 /100 | #277 | Tragic 19.4% |
| Africans | 0.0 /100 | #278 | Tragic 19.5% |
| Ute | 0.0 /100 | #279 | Tragic 19.6% |
| Cajuns | 0.0 /100 | #280 | Tragic 19.6% |
| Cypriots | 0.0 /100 | #281 | Tragic 19.6% |
| Dutch West Indians | 0.0 /100 | #282 | Tragic 19.7% |
| Sioux | 0.0 /100 | #283 | Tragic 19.7% |
| Sierra Leoneans | 0.0 /100 | #284 | Tragic 19.7% |
| Ghanaians | 0.0 /100 | #285 | Tragic 19.8% |
Demographics Similar to Immigrants from Northern Europe by Unemployment Among Ages 16 to 19 years
In terms of unemployment among ages 16 to 19 years, the demographic groups most similar to Immigrants from Northern Europe are Immigrants from Eastern Asia (17.4%, a difference of 0.080%), Romanian (17.3%, a difference of 0.15%), Immigrants from Hong Kong (17.4%, a difference of 0.19%), Immigrants from Northern Africa (17.4%, a difference of 0.21%), and Tsimshian (17.3%, a difference of 0.22%).
| Demographics | Rating | Rank | Unemployment Among Ages 16 to 19 years |
| Immigrants | Egypt | 79.1 /100 | #143 | Good 17.3% |
| Immigrants | England | 78.9 /100 | #144 | Good 17.3% |
| Indians (Asian) | 77.6 /100 | #145 | Good 17.3% |
| Turks | 77.1 /100 | #146 | Good 17.3% |
| Tsimshian | 76.0 /100 | #147 | Good 17.3% |
| Romanians | 74.9 /100 | #148 | Good 17.3% |
| Immigrants | Eastern Asia | 73.8 /100 | #149 | Good 17.4% |
| Immigrants | Northern Europe | 72.5 /100 | #150 | Good 17.4% |
| Immigrants | Hong Kong | 69.3 /100 | #151 | Good 17.4% |
| Immigrants | Northern Africa | 69.0 /100 | #152 | Good 17.4% |
| Immigrants | Afghanistan | 68.6 /100 | #153 | Good 17.4% |
| Afghans | 68.1 /100 | #154 | Good 17.4% |
| Portuguese | 67.3 /100 | #155 | Good 17.4% |
| Costa Ricans | 65.9 /100 | #156 | Good 17.4% |
| Uruguayans | 64.3 /100 | #157 | Good 17.5% |