Afghan vs Yugoslavian Unemployment Among Ages 65 to 74 years
COMPARE
Afghan
Yugoslavian
Unemployment Among Ages 65 to 74 years
Unemployment Among Ages 65 to 74 years Comparison
Afghans
Yugoslavians
5.2%
UNEMPLOYMENT AMONG AGES 65 TO 74 YEARS
99.0/ 100
METRIC RATING
74th/ 347
METRIC RANK
5.2%
UNEMPLOYMENT AMONG AGES 65 TO 74 YEARS
95.5/ 100
METRIC RATING
104th/ 347
METRIC RANK
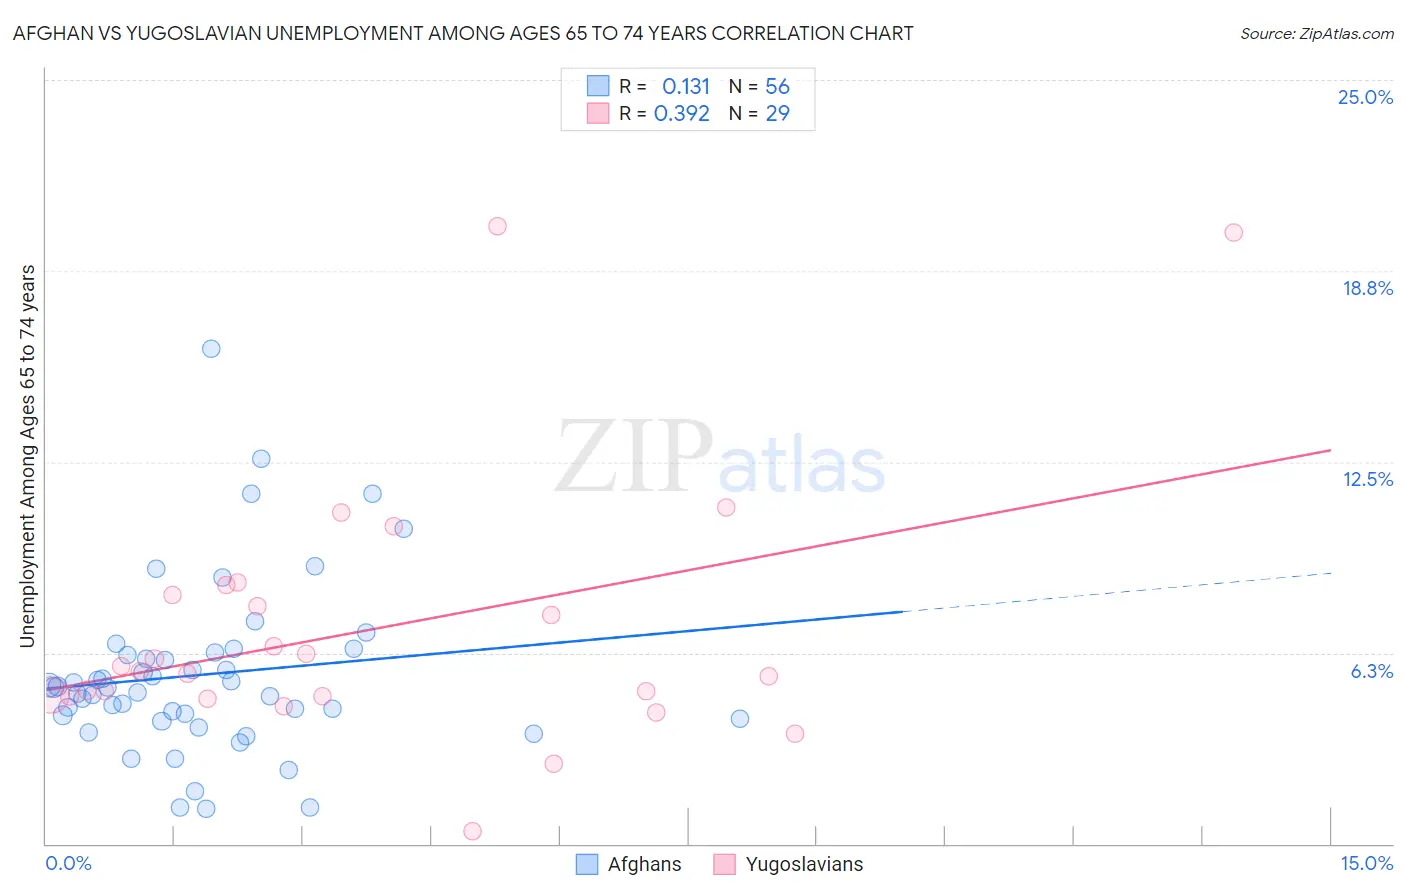
Afghan vs Yugoslavian Unemployment Among Ages 65 to 74 years Correlation Chart
The statistical analysis conducted on geographies consisting of 142,180,614 people shows a poor positive correlation between the proportion of Afghans and unemployment rate among population between the ages 65 and 74 in the United States with a correlation coefficient (R) of 0.131 and weighted average of 5.2%. Similarly, the statistical analysis conducted on geographies consisting of 258,185,683 people shows a mild positive correlation between the proportion of Yugoslavians and unemployment rate among population between the ages 65 and 74 in the United States with a correlation coefficient (R) of 0.392 and weighted average of 5.2%, a difference of 1.3%.
Unemployment Among Ages 65 to 74 years Correlation Summary
| Measurement | Afghan | Yugoslavian |
| Minimum | 1.1% | 0.40% |
| Maximum | 16.2% | 20.2% |
| Range | 15.1% | 19.8% |
| Mean | 5.5% | 7.0% |
| Median | 5.1% | 5.7% |
| Interquartile 25% (IQ1) | 4.2% | 4.8% |
| Interquartile 75% (IQ3) | 6.2% | 8.3% |
| Interquartile Range (IQR) | 2.1% | 3.5% |
| Standard Deviation (Sample) | 2.8% | 4.3% |
| Standard Deviation (Population) | 2.8% | 4.2% |
Similar Demographics by Unemployment Among Ages 65 to 74 years
Demographics Similar to Afghans by Unemployment Among Ages 65 to 74 years
In terms of unemployment among ages 65 to 74 years, the demographic groups most similar to Afghans are Filipino (5.2%, a difference of 0.0%), Okinawan (5.2%, a difference of 0.010%), Estonian (5.2%, a difference of 0.010%), Immigrants from Oceania (5.2%, a difference of 0.020%), and Immigrants from Sudan (5.2%, a difference of 0.020%).
| Demographics | Rating | Rank | Unemployment Among Ages 65 to 74 years |
| Swiss | 99.2 /100 | #67 | Exceptional 5.1% |
| Latvians | 99.2 /100 | #68 | Exceptional 5.1% |
| Scandinavians | 99.1 /100 | #69 | Exceptional 5.2% |
| Immigrants | Japan | 99.1 /100 | #70 | Exceptional 5.2% |
| Scotch-Irish | 99.0 /100 | #71 | Exceptional 5.2% |
| Immigrants | Oceania | 99.0 /100 | #72 | Exceptional 5.2% |
| Filipinos | 99.0 /100 | #73 | Exceptional 5.2% |
| Afghans | 99.0 /100 | #74 | Exceptional 5.2% |
| Okinawans | 99.0 /100 | #75 | Exceptional 5.2% |
| Estonians | 99.0 /100 | #76 | Exceptional 5.2% |
| Immigrants | Sudan | 98.9 /100 | #77 | Exceptional 5.2% |
| Northern Europeans | 98.9 /100 | #78 | Exceptional 5.2% |
| Slavs | 98.7 /100 | #79 | Exceptional 5.2% |
| Immigrants | South Africa | 98.6 /100 | #80 | Exceptional 5.2% |
| Immigrants | Scotland | 98.6 /100 | #81 | Exceptional 5.2% |
Demographics Similar to Yugoslavians by Unemployment Among Ages 65 to 74 years
In terms of unemployment among ages 65 to 74 years, the demographic groups most similar to Yugoslavians are Immigrants from Vietnam (5.2%, a difference of 0.020%), Iranian (5.2%, a difference of 0.050%), Malaysian (5.2%, a difference of 0.070%), Immigrants from Lithuania (5.2%, a difference of 0.090%), and Austrian (5.2%, a difference of 0.18%).
| Demographics | Rating | Rank | Unemployment Among Ages 65 to 74 years |
| Senegalese | 96.5 /100 | #97 | Exceptional 5.2% |
| Welsh | 96.5 /100 | #98 | Exceptional 5.2% |
| Burmese | 96.4 /100 | #99 | Exceptional 5.2% |
| Japanese | 96.4 /100 | #100 | Exceptional 5.2% |
| Immigrants | Cambodia | 96.3 /100 | #101 | Exceptional 5.2% |
| Immigrants | Lithuania | 95.9 /100 | #102 | Exceptional 5.2% |
| Immigrants | Vietnam | 95.6 /100 | #103 | Exceptional 5.2% |
| Yugoslavians | 95.5 /100 | #104 | Exceptional 5.2% |
| Iranians | 95.2 /100 | #105 | Exceptional 5.2% |
| Malaysians | 95.1 /100 | #106 | Exceptional 5.2% |
| Austrians | 94.5 /100 | #107 | Exceptional 5.2% |
| Immigrants | Malaysia | 94.1 /100 | #108 | Exceptional 5.2% |
| Immigrants | Singapore | 93.9 /100 | #109 | Exceptional 5.2% |
| Immigrants | Bolivia | 93.6 /100 | #110 | Exceptional 5.2% |
| Sri Lankans | 92.7 /100 | #111 | Exceptional 5.3% |