Yaqui vs Immigrants from Afghanistan Child Poverty Under the Age of 16
COMPARE
Yaqui
Immigrants from Afghanistan
Child Poverty Under the Age of 16
Child Poverty Under the Age of 16 Comparison
Yaqui
Immigrants from Afghanistan
20.4%
CHILD POVERTY UNDER THE AGE OF 16
0.0/ 100
METRIC RATING
290th/ 347
METRIC RANK
17.0%
CHILD POVERTY UNDER THE AGE OF 16
15.1/ 100
METRIC RATING
199th/ 347
METRIC RANK
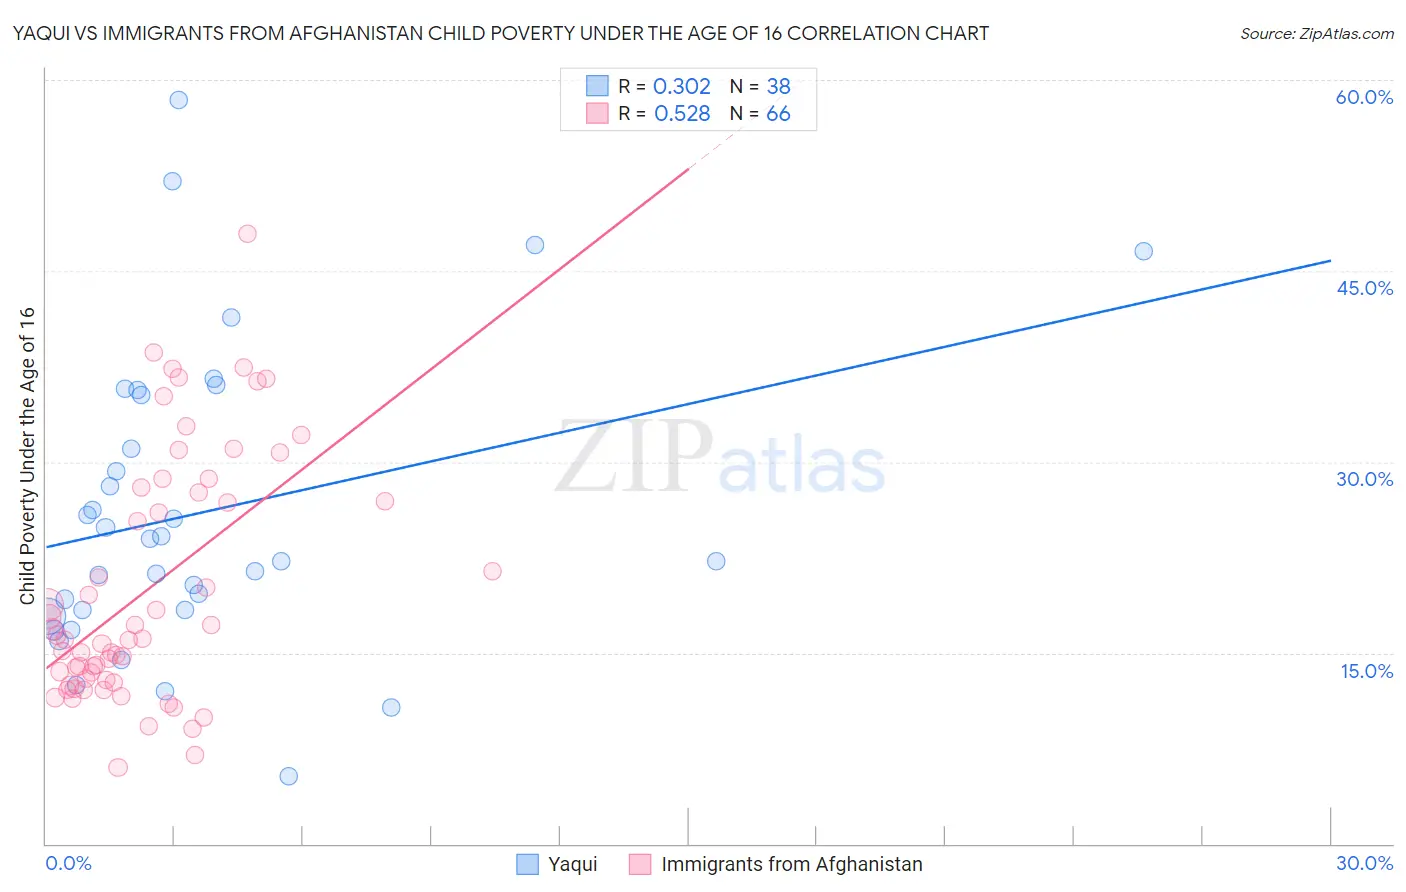
Yaqui vs Immigrants from Afghanistan Child Poverty Under the Age of 16 Correlation Chart
The statistical analysis conducted on geographies consisting of 107,580,409 people shows a mild positive correlation between the proportion of Yaqui and poverty level among children under the age of 16 in the United States with a correlation coefficient (R) of 0.302 and weighted average of 20.4%. Similarly, the statistical analysis conducted on geographies consisting of 147,262,945 people shows a substantial positive correlation between the proportion of Immigrants from Afghanistan and poverty level among children under the age of 16 in the United States with a correlation coefficient (R) of 0.528 and weighted average of 17.0%, a difference of 19.5%.
Child Poverty Under the Age of 16 Correlation Summary
| Measurement | Yaqui | Immigrants from Afghanistan |
| Minimum | 5.4% | 6.0% |
| Maximum | 58.4% | 48.0% |
| Range | 53.0% | 42.0% |
| Mean | 26.0% | 20.0% |
| Median | 23.1% | 16.0% |
| Interquartile 25% (IQ1) | 18.3% | 12.9% |
| Interquartile 75% (IQ3) | 35.3% | 27.6% |
| Interquartile Range (IQR) | 17.0% | 14.7% |
| Standard Deviation (Sample) | 11.9% | 9.6% |
| Standard Deviation (Population) | 11.7% | 9.5% |
Similar Demographics by Child Poverty Under the Age of 16
Demographics Similar to Yaqui by Child Poverty Under the Age of 16
In terms of child poverty under the age of 16, the demographic groups most similar to Yaqui are Senegalese (20.4%, a difference of 0.040%), Immigrants from Belize (20.3%, a difference of 0.28%), Chippewa (20.5%, a difference of 0.75%), Immigrants from Latin America (20.5%, a difference of 0.79%), and Blackfeet (20.2%, a difference of 0.87%).
| Demographics | Rating | Rank | Child Poverty Under the Age of 16 |
| Immigrants | Zaire | 0.0 /100 | #283 | Tragic 20.1% |
| West Indians | 0.0 /100 | #284 | Tragic 20.1% |
| Immigrants | St. Vincent and the Grenadines | 0.0 /100 | #285 | Tragic 20.1% |
| Immigrants | West Indies | 0.0 /100 | #286 | Tragic 20.2% |
| Blackfeet | 0.0 /100 | #287 | Tragic 20.2% |
| Immigrants | Belize | 0.0 /100 | #288 | Tragic 20.3% |
| Senegalese | 0.0 /100 | #289 | Tragic 20.4% |
| Yaqui | 0.0 /100 | #290 | Tragic 20.4% |
| Chippewa | 0.0 /100 | #291 | Tragic 20.5% |
| Immigrants | Latin America | 0.0 /100 | #292 | Tragic 20.5% |
| Immigrants | Senegal | 0.0 /100 | #293 | Tragic 20.6% |
| Haitians | 0.0 /100 | #294 | Tragic 20.7% |
| Mexicans | 0.0 /100 | #295 | Tragic 20.7% |
| Immigrants | Caribbean | 0.0 /100 | #296 | Tragic 20.8% |
| Hispanics or Latinos | 0.0 /100 | #297 | Tragic 20.8% |
Demographics Similar to Immigrants from Afghanistan by Child Poverty Under the Age of 16
In terms of child poverty under the age of 16, the demographic groups most similar to Immigrants from Afghanistan are Immigrants from Cameroon (17.1%, a difference of 0.10%), Immigrants from Uzbekistan (17.1%, a difference of 0.11%), Ugandan (17.1%, a difference of 0.19%), Immigrants from Sierra Leone (17.1%, a difference of 0.21%), and Hmong (17.1%, a difference of 0.27%).
| Demographics | Rating | Rank | Child Poverty Under the Age of 16 |
| Spanish | 24.5 /100 | #192 | Fair 16.7% |
| Spaniards | 23.2 /100 | #193 | Fair 16.8% |
| Immigrants | Uruguay | 23.1 /100 | #194 | Fair 16.8% |
| Immigrants | Uganda | 22.5 /100 | #195 | Fair 16.8% |
| Immigrants | Lebanon | 22.0 /100 | #196 | Fair 16.8% |
| Immigrants | Kenya | 19.1 /100 | #197 | Poor 16.9% |
| Delaware | 17.1 /100 | #198 | Poor 17.0% |
| Immigrants | Afghanistan | 15.1 /100 | #199 | Poor 17.0% |
| Immigrants | Cameroon | 14.7 /100 | #200 | Poor 17.1% |
| Immigrants | Uzbekistan | 14.7 /100 | #201 | Poor 17.1% |
| Ugandans | 14.3 /100 | #202 | Poor 17.1% |
| Immigrants | Sierra Leone | 14.2 /100 | #203 | Poor 17.1% |
| Hmong | 14.0 /100 | #204 | Poor 17.1% |
| Aleuts | 13.9 /100 | #205 | Poor 17.1% |
| Alaska Natives | 11.8 /100 | #206 | Poor 17.2% |