Welsh vs Korean Child Poverty Under the Age of 16
COMPARE
Welsh
Korean
Child Poverty Under the Age of 16
Child Poverty Under the Age of 16 Comparison
Welsh
Koreans
15.3%
CHILD POVERTY UNDER THE AGE OF 16
87.2/ 100
METRIC RATING
138th/ 347
METRIC RANK
13.9%
CHILD POVERTY UNDER THE AGE OF 16
99.2/ 100
METRIC RATING
48th/ 347
METRIC RANK
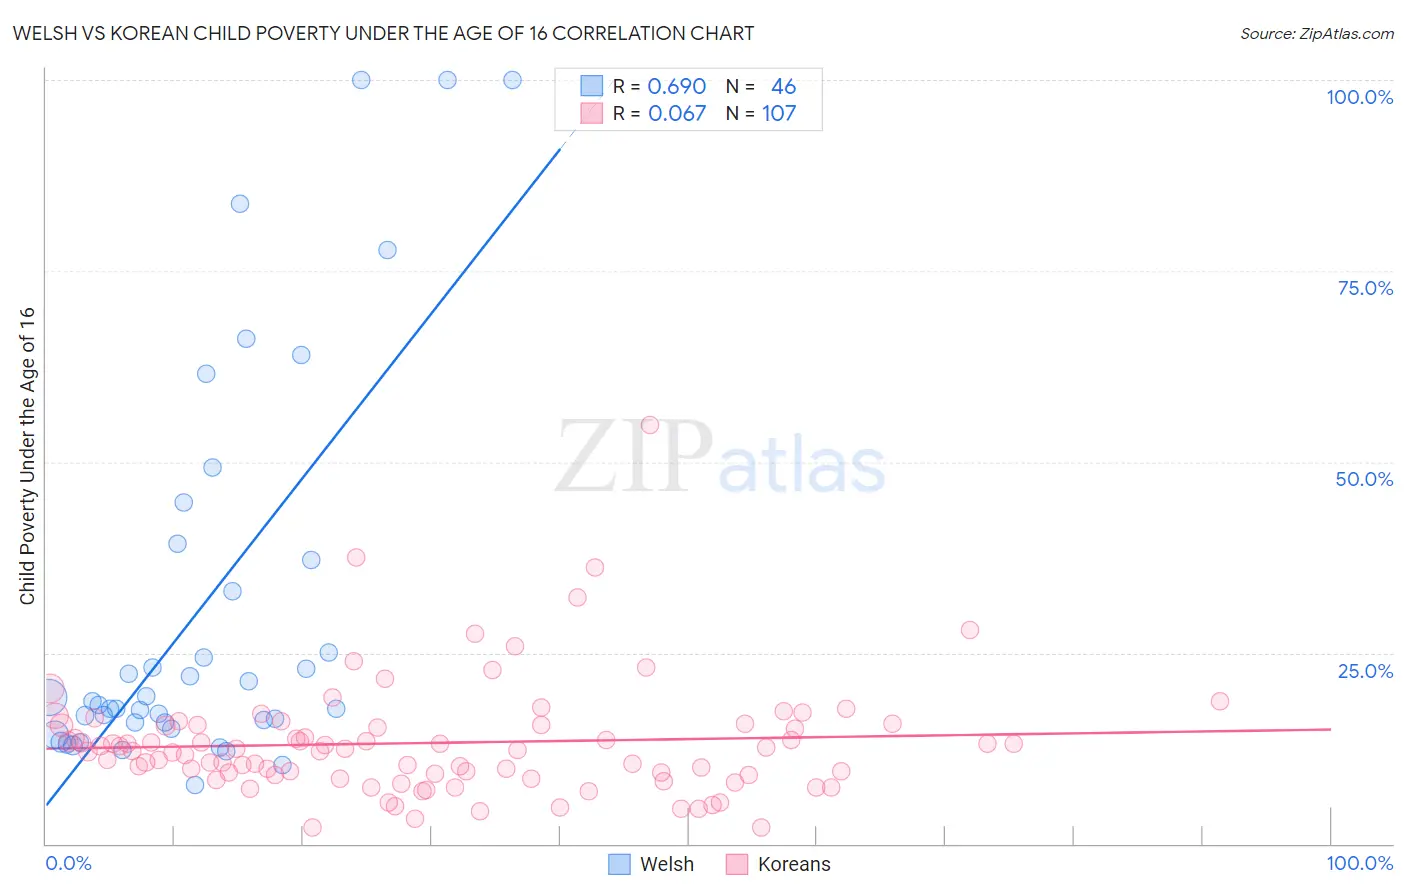
Welsh vs Korean Child Poverty Under the Age of 16 Correlation Chart
The statistical analysis conducted on geographies consisting of 519,115,180 people shows a significant positive correlation between the proportion of Welsh and poverty level among children under the age of 16 in the United States with a correlation coefficient (R) of 0.690 and weighted average of 15.3%. Similarly, the statistical analysis conducted on geographies consisting of 503,868,115 people shows a slight positive correlation between the proportion of Koreans and poverty level among children under the age of 16 in the United States with a correlation coefficient (R) of 0.067 and weighted average of 13.9%, a difference of 10.1%.
Child Poverty Under the Age of 16 Correlation Summary
| Measurement | Welsh | Korean |
| Minimum | 7.7% | 2.1% |
| Maximum | 100.0% | 54.8% |
| Range | 92.3% | 52.7% |
| Mean | 30.8% | 13.2% |
| Median | 18.4% | 12.2% |
| Interquartile 25% (IQ1) | 15.9% | 9.0% |
| Interquartile 75% (IQ3) | 37.1% | 15.5% |
| Interquartile Range (IQR) | 21.2% | 6.6% |
| Standard Deviation (Sample) | 25.9% | 7.6% |
| Standard Deviation (Population) | 25.6% | 7.5% |
Similar Demographics by Child Poverty Under the Age of 16
Demographics Similar to Welsh by Child Poverty Under the Age of 16
In terms of child poverty under the age of 16, the demographic groups most similar to Welsh are Peruvian (15.3%, a difference of 0.010%), Immigrants from Spain (15.3%, a difference of 0.040%), Immigrants from Vietnam (15.3%, a difference of 0.040%), New Zealander (15.3%, a difference of 0.10%), and Albanian (15.2%, a difference of 0.41%).
| Demographics | Rating | Rank | Child Poverty Under the Age of 16 |
| Armenians | 89.4 /100 | #131 | Excellent 15.2% |
| Canadians | 89.1 /100 | #132 | Excellent 15.2% |
| Immigrants | South Eastern Asia | 89.0 /100 | #133 | Excellent 15.2% |
| Native Hawaiians | 88.7 /100 | #134 | Excellent 15.2% |
| Albanians | 88.6 /100 | #135 | Excellent 15.2% |
| Immigrants | Spain | 87.3 /100 | #136 | Excellent 15.3% |
| Peruvians | 87.2 /100 | #137 | Excellent 15.3% |
| Welsh | 87.2 /100 | #138 | Excellent 15.3% |
| Immigrants | Vietnam | 87.1 /100 | #139 | Excellent 15.3% |
| New Zealanders | 86.9 /100 | #140 | Excellent 15.3% |
| Slavs | 84.2 /100 | #141 | Excellent 15.4% |
| Brazilians | 82.8 /100 | #142 | Excellent 15.4% |
| Icelanders | 82.5 /100 | #143 | Excellent 15.4% |
| Immigrants | Hungary | 81.9 /100 | #144 | Excellent 15.5% |
| Immigrants | Peru | 81.7 /100 | #145 | Excellent 15.5% |
Demographics Similar to Koreans by Child Poverty Under the Age of 16
In terms of child poverty under the age of 16, the demographic groups most similar to Koreans are Italian (13.9%, a difference of 0.030%), Estonian (13.9%, a difference of 0.060%), Immigrants from Asia (13.8%, a difference of 0.22%), Immigrants from Czechoslovakia (13.9%, a difference of 0.26%), and Immigrants from Greece (13.9%, a difference of 0.38%).
| Demographics | Rating | Rank | Child Poverty Under the Age of 16 |
| Croatians | 99.4 /100 | #41 | Exceptional 13.8% |
| Immigrants | Sri Lanka | 99.3 /100 | #42 | Exceptional 13.8% |
| Immigrants | Moldova | 99.3 /100 | #43 | Exceptional 13.8% |
| Greeks | 99.3 /100 | #44 | Exceptional 13.8% |
| Czechs | 99.3 /100 | #45 | Exceptional 13.8% |
| Immigrants | Asia | 99.2 /100 | #46 | Exceptional 13.8% |
| Estonians | 99.2 /100 | #47 | Exceptional 13.9% |
| Koreans | 99.2 /100 | #48 | Exceptional 13.9% |
| Italians | 99.2 /100 | #49 | Exceptional 13.9% |
| Immigrants | Czechoslovakia | 99.1 /100 | #50 | Exceptional 13.9% |
| Immigrants | Greece | 99.1 /100 | #51 | Exceptional 13.9% |
| Poles | 98.9 /100 | #52 | Exceptional 14.0% |
| Immigrants | Israel | 98.8 /100 | #53 | Exceptional 14.1% |
| Tsimshian | 98.8 /100 | #54 | Exceptional 14.1% |
| Immigrants | Indonesia | 98.7 /100 | #55 | Exceptional 14.1% |