Venezuelan vs Immigrants from Italy Seniors Poverty Over the Age of 75
COMPARE
Venezuelan
Immigrants from Italy
Seniors Poverty Over the Age of 75
Seniors Poverty Over the Age of 75 Comparison
Venezuelans
Immigrants from Italy
14.2%
SENIORS POVERTY OVER THE AGE OF 75
0.0/ 100
METRIC RATING
267th/ 347
METRIC RANK
11.8%
SENIORS POVERTY OVER THE AGE OF 75
84.0/ 100
METRIC RATING
123rd/ 347
METRIC RANK
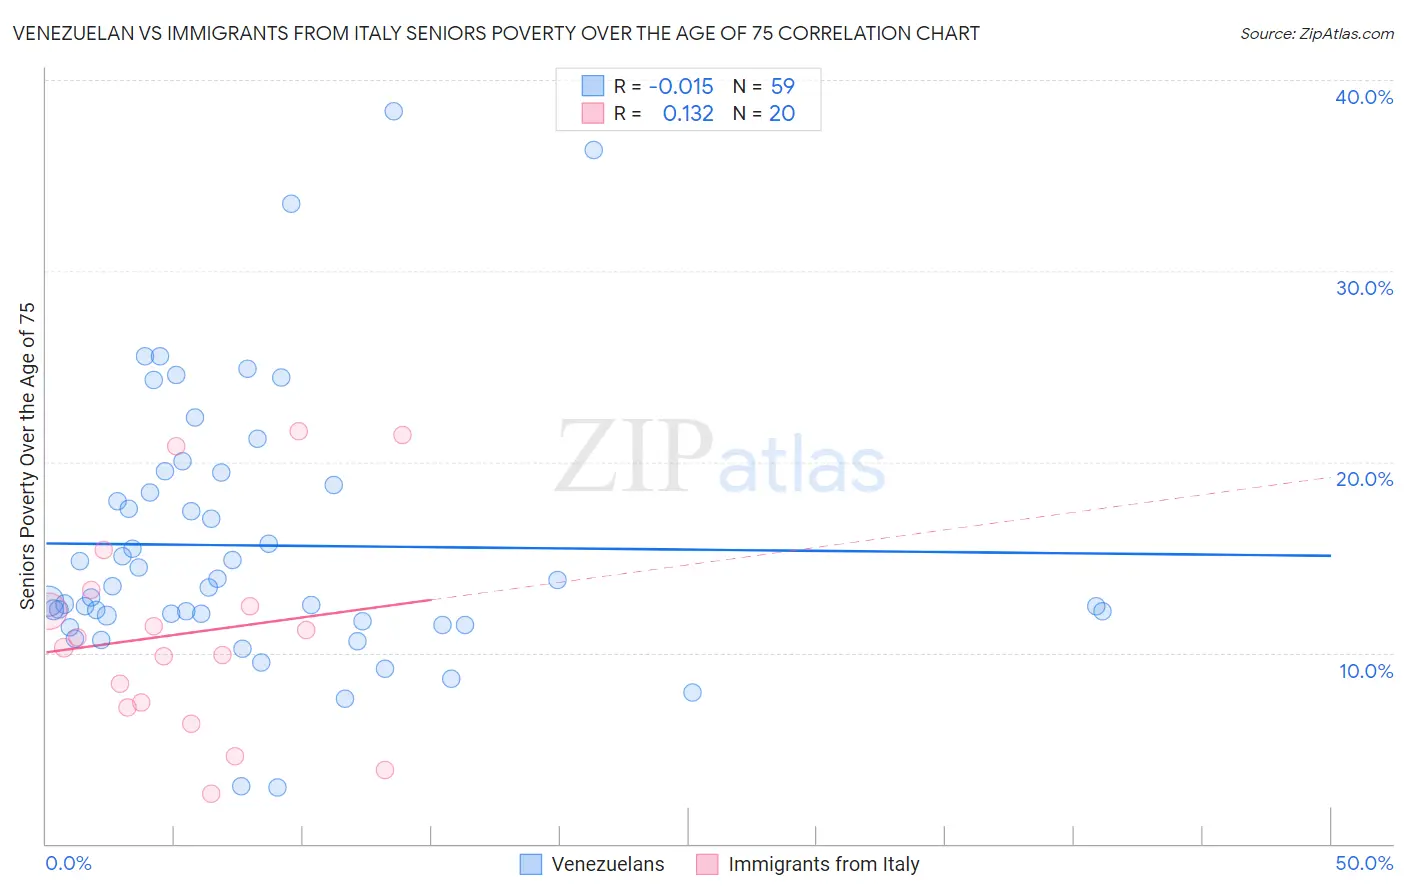
Venezuelan vs Immigrants from Italy Seniors Poverty Over the Age of 75 Correlation Chart
The statistical analysis conducted on geographies consisting of 303,492,801 people shows no correlation between the proportion of Venezuelans and poverty level among seniors over the age of 75 in the United States with a correlation coefficient (R) of -0.015 and weighted average of 14.2%. Similarly, the statistical analysis conducted on geographies consisting of 321,525,031 people shows a poor positive correlation between the proportion of Immigrants from Italy and poverty level among seniors over the age of 75 in the United States with a correlation coefficient (R) of 0.132 and weighted average of 11.8%, a difference of 20.6%.
Seniors Poverty Over the Age of 75 Correlation Summary
| Measurement | Venezuelan | Immigrants from Italy |
| Minimum | 2.9% | 2.6% |
| Maximum | 38.4% | 21.6% |
| Range | 35.4% | 19.0% |
| Mean | 15.6% | 11.0% |
| Median | 13.5% | 10.5% |
| Interquartile 25% (IQ1) | 11.6% | 7.3% |
| Interquartile 75% (IQ3) | 18.8% | 12.9% |
| Interquartile Range (IQR) | 7.1% | 5.6% |
| Standard Deviation (Sample) | 7.0% | 5.5% |
| Standard Deviation (Population) | 7.0% | 5.3% |
Similar Demographics by Seniors Poverty Over the Age of 75
Demographics Similar to Venezuelans by Seniors Poverty Over the Age of 75
In terms of seniors poverty over the age of 75, the demographic groups most similar to Venezuelans are Armenian (14.2%, a difference of 0.020%), Salvadoran (14.2%, a difference of 0.24%), Colombian (14.3%, a difference of 0.35%), Immigrants from Venezuela (14.3%, a difference of 0.46%), and South American (14.1%, a difference of 0.48%).
| Demographics | Rating | Rank | Seniors Poverty Over the Age of 75 |
| Immigrants | Immigrants | 0.1 /100 | #260 | Tragic 13.9% |
| Ghanaians | 0.1 /100 | #261 | Tragic 14.0% |
| Cajuns | 0.1 /100 | #262 | Tragic 14.0% |
| Iroquois | 0.1 /100 | #263 | Tragic 14.0% |
| South Americans | 0.0 /100 | #264 | Tragic 14.1% |
| Salvadorans | 0.0 /100 | #265 | Tragic 14.2% |
| Armenians | 0.0 /100 | #266 | Tragic 14.2% |
| Venezuelans | 0.0 /100 | #267 | Tragic 14.2% |
| Colombians | 0.0 /100 | #268 | Tragic 14.3% |
| Immigrants | Venezuela | 0.0 /100 | #269 | Tragic 14.3% |
| Immigrants | Uruguay | 0.0 /100 | #270 | Tragic 14.3% |
| Immigrants | Ghana | 0.0 /100 | #271 | Tragic 14.4% |
| Mexicans | 0.0 /100 | #272 | Tragic 14.4% |
| Immigrants | South America | 0.0 /100 | #273 | Tragic 14.4% |
| Immigrants | Bahamas | 0.0 /100 | #274 | Tragic 14.4% |
Demographics Similar to Immigrants from Italy by Seniors Poverty Over the Age of 75
In terms of seniors poverty over the age of 75, the demographic groups most similar to Immigrants from Italy are Pakistani (11.8%, a difference of 0.0%), Malaysian (11.8%, a difference of 0.010%), Fijian (11.8%, a difference of 0.030%), Sudanese (11.8%, a difference of 0.060%), and Immigrants from Nepal (11.8%, a difference of 0.090%).
| Demographics | Rating | Rank | Seniors Poverty Over the Age of 75 |
| Iraqis | 86.3 /100 | #116 | Excellent 11.7% |
| Icelanders | 85.7 /100 | #117 | Excellent 11.7% |
| Immigrants | Zimbabwe | 85.5 /100 | #118 | Excellent 11.7% |
| Immigrants | Uganda | 84.8 /100 | #119 | Excellent 11.8% |
| Immigrants | Nepal | 84.5 /100 | #120 | Excellent 11.8% |
| Malaysians | 84.1 /100 | #121 | Excellent 11.8% |
| Pakistanis | 84.0 /100 | #122 | Excellent 11.8% |
| Immigrants | Italy | 84.0 /100 | #123 | Excellent 11.8% |
| Fijians | 83.8 /100 | #124 | Excellent 11.8% |
| Sudanese | 83.6 /100 | #125 | Excellent 11.8% |
| Pennsylvania Germans | 83.4 /100 | #126 | Excellent 11.8% |
| Immigrants | Denmark | 82.6 /100 | #127 | Excellent 11.8% |
| Immigrants | Hungary | 81.7 /100 | #128 | Excellent 11.8% |
| Ethiopians | 80.7 /100 | #129 | Excellent 11.8% |
| Spanish | 80.5 /100 | #130 | Excellent 11.8% |