Ukrainian vs Immigrants from Indonesia Female Poverty Among 25-34 Year Olds
COMPARE
Ukrainian
Immigrants from Indonesia
Female Poverty Among 25-34 Year Olds
Female Poverty Among 25-34 Year Olds Comparison
Ukrainians
Immigrants from Indonesia
12.6%
FEMALE POVERTY AMONG 25-34 YEAR OLDS
96.7/ 100
METRIC RATING
95th/ 347
METRIC RANK
11.8%
FEMALE POVERTY AMONG 25-34 YEAR OLDS
99.8/ 100
METRIC RATING
41st/ 347
METRIC RANK
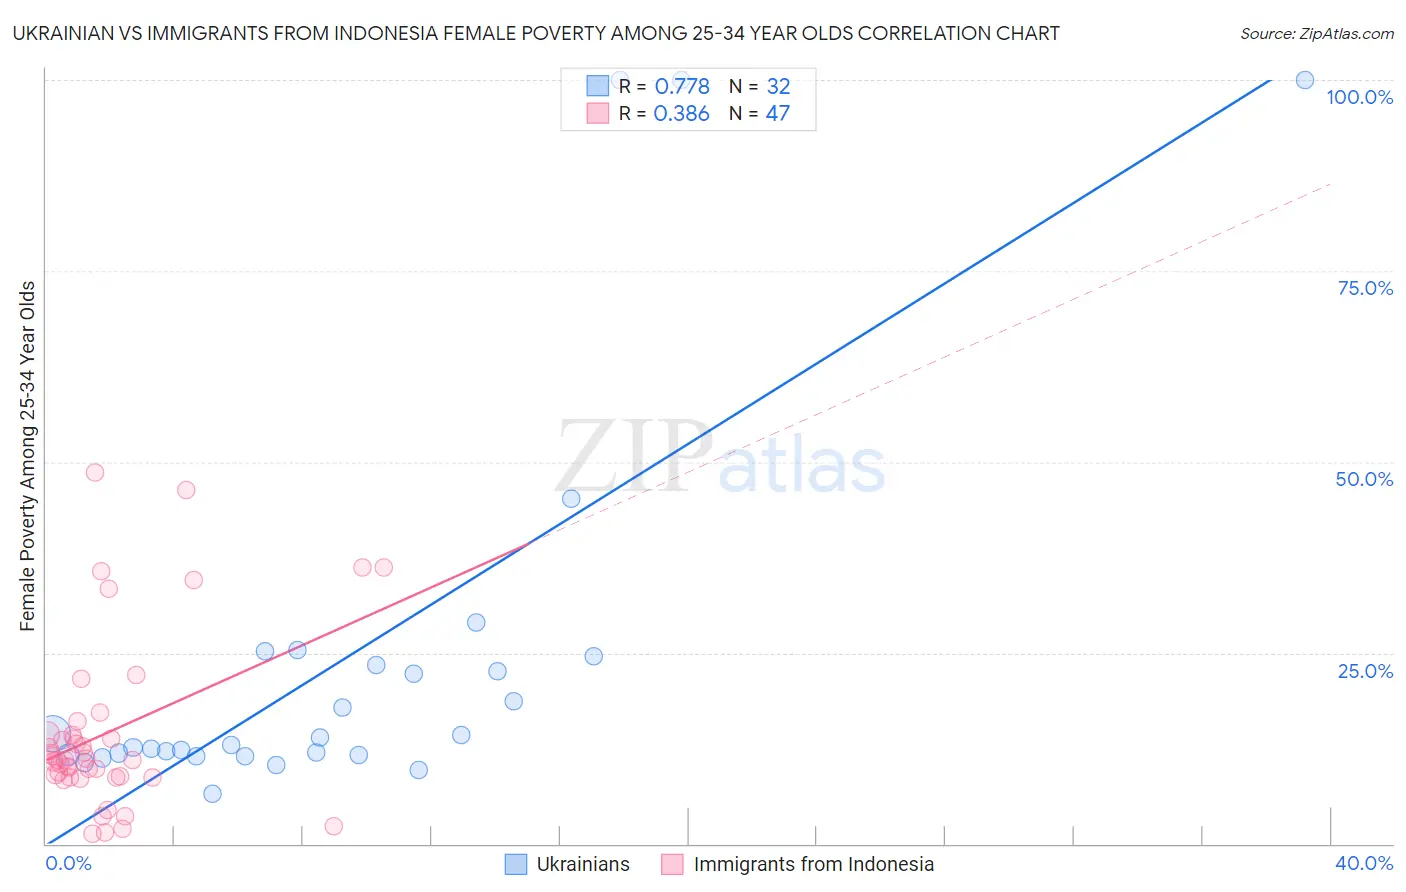
Ukrainian vs Immigrants from Indonesia Female Poverty Among 25-34 Year Olds Correlation Chart
The statistical analysis conducted on geographies consisting of 437,000,334 people shows a strong positive correlation between the proportion of Ukrainians and poverty level among females between the ages 25 and 34 in the United States with a correlation coefficient (R) of 0.778 and weighted average of 12.6%. Similarly, the statistical analysis conducted on geographies consisting of 214,279,540 people shows a mild positive correlation between the proportion of Immigrants from Indonesia and poverty level among females between the ages 25 and 34 in the United States with a correlation coefficient (R) of 0.386 and weighted average of 11.8%, a difference of 6.2%.
Female Poverty Among 25-34 Year Olds Correlation Summary
| Measurement | Ukrainian | Immigrants from Indonesia |
| Minimum | 6.6% | 1.3% |
| Maximum | 100.0% | 48.7% |
| Range | 93.4% | 47.4% |
| Mean | 24.3% | 14.6% |
| Median | 13.4% | 11.0% |
| Interquartile 25% (IQ1) | 11.6% | 8.7% |
| Interquartile 75% (IQ3) | 24.0% | 14.3% |
| Interquartile Range (IQR) | 12.3% | 5.6% |
| Standard Deviation (Sample) | 25.9% | 11.3% |
| Standard Deviation (Population) | 25.5% | 11.2% |
Similar Demographics by Female Poverty Among 25-34 Year Olds
Demographics Similar to Ukrainians by Female Poverty Among 25-34 Year Olds
In terms of female poverty among 25-34 year olds, the demographic groups most similar to Ukrainians are Immigrants from Zimbabwe (12.6%, a difference of 0.010%), Immigrants from France (12.6%, a difference of 0.040%), Palestinian (12.6%, a difference of 0.090%), Immigrants from Armenia (12.6%, a difference of 0.12%), and Norwegian (12.6%, a difference of 0.13%).
| Demographics | Rating | Rank | Female Poverty Among 25-34 Year Olds |
| Immigrants | Austria | 97.4 /100 | #88 | Exceptional 12.5% |
| Italians | 97.2 /100 | #89 | Exceptional 12.5% |
| Immigrants | Albania | 97.1 /100 | #90 | Exceptional 12.5% |
| Norwegians | 96.9 /100 | #91 | Exceptional 12.6% |
| Immigrants | Armenia | 96.9 /100 | #92 | Exceptional 12.6% |
| Palestinians | 96.9 /100 | #93 | Exceptional 12.6% |
| Immigrants | France | 96.8 /100 | #94 | Exceptional 12.6% |
| Ukrainians | 96.7 /100 | #95 | Exceptional 12.6% |
| Immigrants | Zimbabwe | 96.7 /100 | #96 | Exceptional 12.6% |
| Immigrants | Northern Africa | 96.6 /100 | #97 | Exceptional 12.6% |
| Immigrants | Ethiopia | 96.5 /100 | #98 | Exceptional 12.6% |
| Immigrants | Argentina | 96.4 /100 | #99 | Exceptional 12.6% |
| Immigrants | Denmark | 95.7 /100 | #100 | Exceptional 12.7% |
| Immigrants | Switzerland | 95.7 /100 | #101 | Exceptional 12.7% |
| Peruvians | 95.6 /100 | #102 | Exceptional 12.7% |
Demographics Similar to Immigrants from Indonesia by Female Poverty Among 25-34 Year Olds
In terms of female poverty among 25-34 year olds, the demographic groups most similar to Immigrants from Indonesia are Immigrants from Bulgaria (11.8%, a difference of 0.13%), Latvian (11.8%, a difference of 0.29%), Immigrants from Turkey (11.9%, a difference of 0.30%), Immigrants from North Macedonia (11.8%, a difference of 0.54%), and Egyptian (11.9%, a difference of 0.55%).
| Demographics | Rating | Rank | Female Poverty Among 25-34 Year Olds |
| Zimbabweans | 99.9 /100 | #34 | Exceptional 11.7% |
| Cambodians | 99.9 /100 | #35 | Exceptional 11.7% |
| Immigrants | Sri Lanka | 99.8 /100 | #36 | Exceptional 11.8% |
| Taiwanese | 99.8 /100 | #37 | Exceptional 11.8% |
| Immigrants | North Macedonia | 99.8 /100 | #38 | Exceptional 11.8% |
| Latvians | 99.8 /100 | #39 | Exceptional 11.8% |
| Immigrants | Bulgaria | 99.8 /100 | #40 | Exceptional 11.8% |
| Immigrants | Indonesia | 99.8 /100 | #41 | Exceptional 11.8% |
| Immigrants | Turkey | 99.7 /100 | #42 | Exceptional 11.9% |
| Egyptians | 99.7 /100 | #43 | Exceptional 11.9% |
| Immigrants | Australia | 99.7 /100 | #44 | Exceptional 11.9% |
| Macedonians | 99.7 /100 | #45 | Exceptional 11.9% |
| Immigrants | Serbia | 99.7 /100 | #46 | Exceptional 11.9% |
| Koreans | 99.6 /100 | #47 | Exceptional 12.0% |
| Immigrants | Belarus | 99.6 /100 | #48 | Exceptional 12.0% |