Ugandan vs Indonesian Seniors Poverty Over the Age of 75
COMPARE
Ugandan
Indonesian
Seniors Poverty Over the Age of 75
Seniors Poverty Over the Age of 75 Comparison
Ugandans
Indonesians
11.9%
SENIORS POVERTY OVER THE AGE OF 75
77.1/ 100
METRIC RATING
134th/ 347
METRIC RANK
12.1%
SENIORS POVERTY OVER THE AGE OF 75
62.6/ 100
METRIC RATING
155th/ 347
METRIC RANK
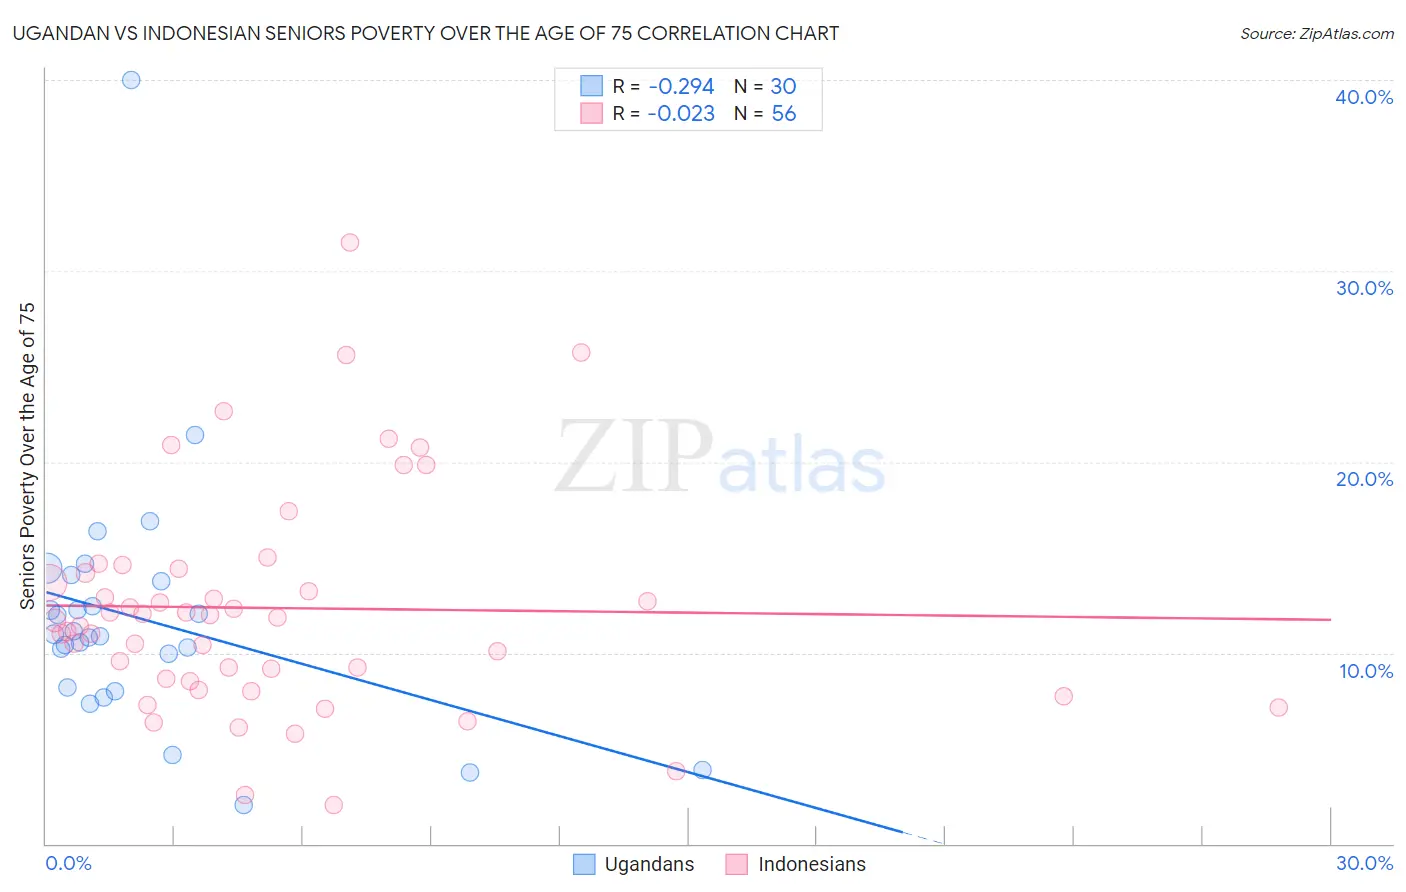
Ugandan vs Indonesian Seniors Poverty Over the Age of 75 Correlation Chart
The statistical analysis conducted on geographies consisting of 93,703,303 people shows a weak negative correlation between the proportion of Ugandans and poverty level among seniors over the age of 75 in the United States with a correlation coefficient (R) of -0.294 and weighted average of 11.9%. Similarly, the statistical analysis conducted on geographies consisting of 161,954,632 people shows no correlation between the proportion of Indonesians and poverty level among seniors over the age of 75 in the United States with a correlation coefficient (R) of -0.023 and weighted average of 12.1%, a difference of 1.5%.
Seniors Poverty Over the Age of 75 Correlation Summary
| Measurement | Ugandan | Indonesian |
| Minimum | 2.1% | 2.1% |
| Maximum | 40.0% | 31.5% |
| Range | 37.9% | 29.5% |
| Mean | 11.8% | 12.3% |
| Median | 10.9% | 11.8% |
| Interquartile 25% (IQ1) | 8.2% | 8.6% |
| Interquartile 75% (IQ3) | 13.8% | 14.3% |
| Interquartile Range (IQR) | 5.5% | 5.7% |
| Standard Deviation (Sample) | 6.7% | 5.8% |
| Standard Deviation (Population) | 6.6% | 5.8% |
Similar Demographics by Seniors Poverty Over the Age of 75
Demographics Similar to Ugandans by Seniors Poverty Over the Age of 75
In terms of seniors poverty over the age of 75, the demographic groups most similar to Ugandans are Immigrants from Sierra Leone (11.9%, a difference of 0.060%), Immigrants from Ireland (11.9%, a difference of 0.10%), Lebanese (11.9%, a difference of 0.15%), Immigrants from Philippines (11.9%, a difference of 0.24%), and Immigrants from Western Europe (11.9%, a difference of 0.31%).
| Demographics | Rating | Rank | Seniors Poverty Over the Age of 75 |
| Immigrants | Denmark | 82.6 /100 | #127 | Excellent 11.8% |
| Immigrants | Hungary | 81.7 /100 | #128 | Excellent 11.8% |
| Ethiopians | 80.7 /100 | #129 | Excellent 11.8% |
| Spanish | 80.5 /100 | #130 | Excellent 11.8% |
| Immigrants | Western Europe | 79.6 /100 | #131 | Good 11.9% |
| Lebanese | 78.3 /100 | #132 | Good 11.9% |
| Immigrants | Sierra Leone | 77.6 /100 | #133 | Good 11.9% |
| Ugandans | 77.1 /100 | #134 | Good 11.9% |
| Immigrants | Ireland | 76.2 /100 | #135 | Good 11.9% |
| Immigrants | Philippines | 75.0 /100 | #136 | Good 11.9% |
| Immigrants | Moldova | 74.1 /100 | #137 | Good 11.9% |
| Immigrants | Romania | 72.6 /100 | #138 | Good 11.9% |
| Immigrants | Kenya | 72.6 /100 | #139 | Good 11.9% |
| Immigrants | Pakistan | 71.9 /100 | #140 | Good 12.0% |
| Immigrants | Cameroon | 71.7 /100 | #141 | Good 12.0% |
Demographics Similar to Indonesians by Seniors Poverty Over the Age of 75
In terms of seniors poverty over the age of 75, the demographic groups most similar to Indonesians are Immigrants from Burma/Myanmar (12.1%, a difference of 0.020%), Immigrants from Sudan (12.1%, a difference of 0.080%), Cambodian (12.0%, a difference of 0.12%), Portuguese (12.1%, a difference of 0.12%), and Immigrants from Middle Africa (12.1%, a difference of 0.12%).
| Demographics | Rating | Rank | Seniors Poverty Over the Age of 75 |
| Immigrants | Zaire | 67.6 /100 | #148 | Good 12.0% |
| Asians | 67.4 /100 | #149 | Good 12.0% |
| Cypriots | 67.3 /100 | #150 | Good 12.0% |
| Cherokee | 65.8 /100 | #151 | Good 12.0% |
| Immigrants | Korea | 65.5 /100 | #152 | Good 12.0% |
| Immigrants | Turkey | 64.7 /100 | #153 | Good 12.0% |
| Cambodians | 64.0 /100 | #154 | Good 12.0% |
| Indonesians | 62.6 /100 | #155 | Good 12.1% |
| Immigrants | Burma/Myanmar | 62.3 /100 | #156 | Good 12.1% |
| Immigrants | Sudan | 61.7 /100 | #157 | Good 12.1% |
| Portuguese | 61.3 /100 | #158 | Good 12.1% |
| Immigrants | Middle Africa | 61.2 /100 | #159 | Good 12.1% |
| Immigrants | Eastern Africa | 60.9 /100 | #160 | Good 12.1% |
| Immigrants | Norway | 60.6 /100 | #161 | Good 12.1% |
| Immigrants | Serbia | 60.2 /100 | #162 | Good 12.1% |