Tohono O'odham vs Immigrants from Belgium Seniors Poverty Over the Age of 75
COMPARE
Tohono O'odham
Immigrants from Belgium
Seniors Poverty Over the Age of 75
Seniors Poverty Over the Age of 75 Comparison
Tohono O'odham
Immigrants from Belgium
19.1%
SENIORS POVERTY OVER THE AGE OF 75
0.0/ 100
METRIC RATING
340th/ 347
METRIC RANK
12.0%
SENIORS POVERTY OVER THE AGE OF 75
70.8/ 100
METRIC RATING
145th/ 347
METRIC RANK
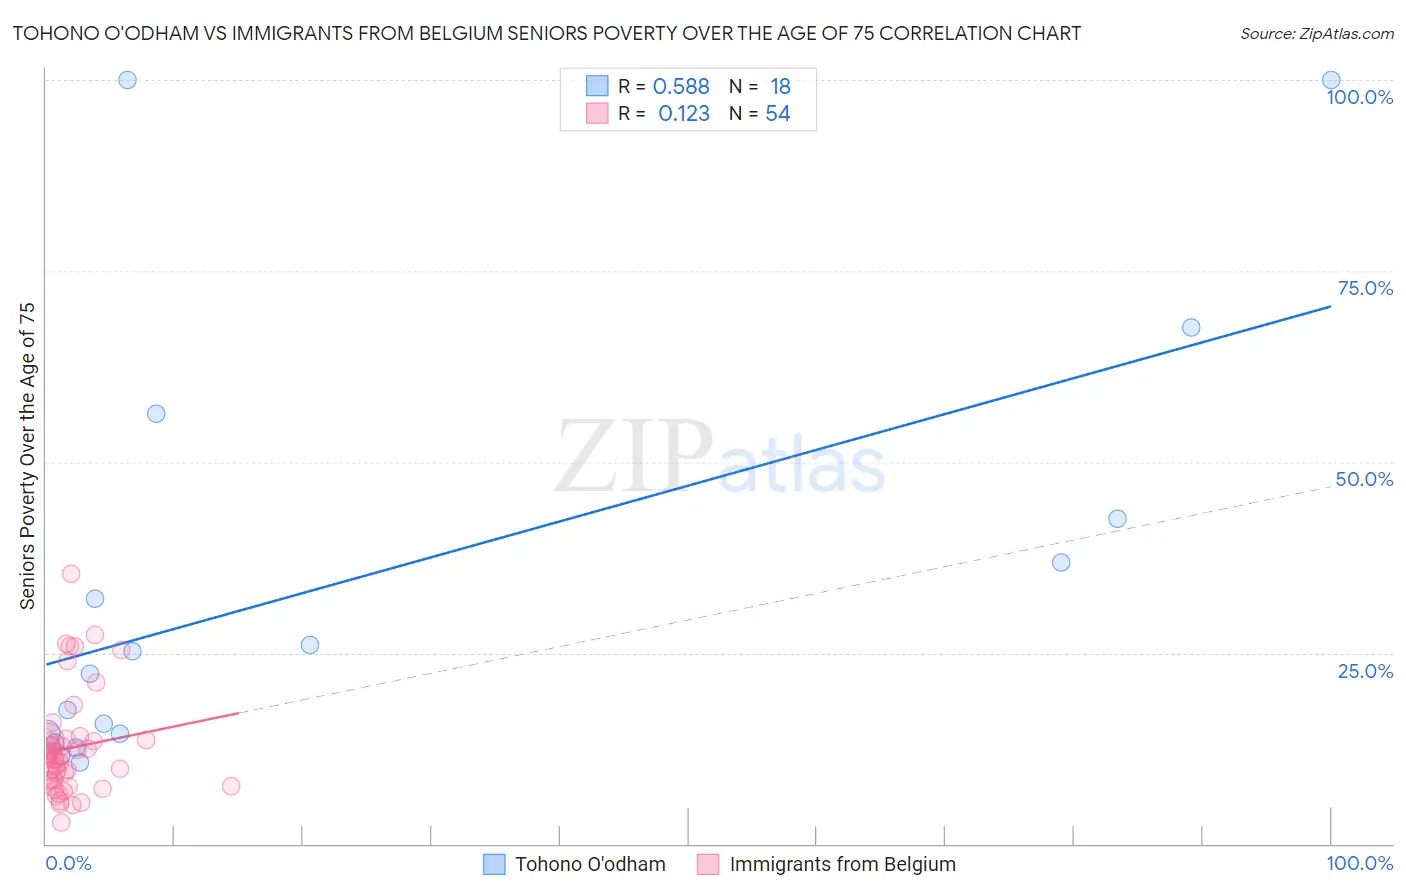
Tohono O'odham vs Immigrants from Belgium Seniors Poverty Over the Age of 75 Correlation Chart
The statistical analysis conducted on geographies consisting of 58,613,882 people shows a substantial positive correlation between the proportion of Tohono O'odham and poverty level among seniors over the age of 75 in the United States with a correlation coefficient (R) of 0.588 and weighted average of 19.1%. Similarly, the statistical analysis conducted on geographies consisting of 145,882,918 people shows a poor positive correlation between the proportion of Immigrants from Belgium and poverty level among seniors over the age of 75 in the United States with a correlation coefficient (R) of 0.123 and weighted average of 12.0%, a difference of 59.9%.
Seniors Poverty Over the Age of 75 Correlation Summary
| Measurement | Tohono O'odham | Immigrants from Belgium |
| Minimum | 10.7% | 2.7% |
| Maximum | 100.0% | 35.4% |
| Range | 89.3% | 32.6% |
| Mean | 34.4% | 12.5% |
| Median | 23.7% | 11.2% |
| Interquartile 25% (IQ1) | 14.3% | 8.3% |
| Interquartile 75% (IQ3) | 42.5% | 13.5% |
| Interquartile Range (IQR) | 28.2% | 5.2% |
| Standard Deviation (Sample) | 28.7% | 6.7% |
| Standard Deviation (Population) | 27.9% | 6.6% |
Similar Demographics by Seniors Poverty Over the Age of 75
Demographics Similar to Tohono O'odham by Seniors Poverty Over the Age of 75
In terms of seniors poverty over the age of 75, the demographic groups most similar to Tohono O'odham are Navajo (19.4%, a difference of 1.3%), Hopi (18.9%, a difference of 1.5%), Dominican (19.6%, a difference of 2.5%), Lumbee (19.7%, a difference of 3.2%), and Immigrants from Cabo Verde (18.5%, a difference of 3.5%).
| Demographics | Rating | Rank | Seniors Poverty Over the Age of 75 |
| Immigrants | Nicaragua | 0.0 /100 | #333 | Tragic 17.6% |
| Immigrants | Grenada | 0.0 /100 | #334 | Tragic 17.8% |
| Cubans | 0.0 /100 | #335 | Tragic 18.0% |
| Immigrants | Caribbean | 0.0 /100 | #336 | Tragic 18.2% |
| Yakama | 0.0 /100 | #337 | Tragic 18.3% |
| Immigrants | Cabo Verde | 0.0 /100 | #338 | Tragic 18.5% |
| Hopi | 0.0 /100 | #339 | Tragic 18.9% |
| Tohono O'odham | 0.0 /100 | #340 | Tragic 19.1% |
| Navajo | 0.0 /100 | #341 | Tragic 19.4% |
| Dominicans | 0.0 /100 | #342 | Tragic 19.6% |
| Lumbee | 0.0 /100 | #343 | Tragic 19.7% |
| Immigrants | Cuba | 0.0 /100 | #344 | Tragic 19.9% |
| Immigrants | Dominican Republic | 0.0 /100 | #345 | Tragic 20.1% |
| Puerto Ricans | 0.0 /100 | #346 | Tragic 23.2% |
| Pima | 0.0 /100 | #347 | Tragic 23.9% |
Demographics Similar to Immigrants from Belgium by Seniors Poverty Over the Age of 75
In terms of seniors poverty over the age of 75, the demographic groups most similar to Immigrants from Belgium are Hmong (12.0%, a difference of 0.0%), American (12.0%, a difference of 0.010%), Bangladeshi (12.0%, a difference of 0.050%), Immigrants from Laos (12.0%, a difference of 0.060%), and Immigrants from Cameroon (12.0%, a difference of 0.090%).
| Demographics | Rating | Rank | Seniors Poverty Over the Age of 75 |
| Immigrants | Romania | 72.6 /100 | #138 | Good 11.9% |
| Immigrants | Kenya | 72.6 /100 | #139 | Good 11.9% |
| Immigrants | Pakistan | 71.9 /100 | #140 | Good 12.0% |
| Immigrants | Cameroon | 71.7 /100 | #141 | Good 12.0% |
| Immigrants | Laos | 71.5 /100 | #142 | Good 12.0% |
| Americans | 71.0 /100 | #143 | Good 12.0% |
| Hmong | 70.8 /100 | #144 | Good 12.0% |
| Immigrants | Belgium | 70.8 /100 | #145 | Good 12.0% |
| Bangladeshis | 70.4 /100 | #146 | Good 12.0% |
| Immigrants | Latvia | 69.1 /100 | #147 | Good 12.0% |
| Immigrants | Zaire | 67.6 /100 | #148 | Good 12.0% |
| Asians | 67.4 /100 | #149 | Good 12.0% |
| Cypriots | 67.3 /100 | #150 | Good 12.0% |
| Cherokee | 65.8 /100 | #151 | Good 12.0% |
| Immigrants | Korea | 65.5 /100 | #152 | Good 12.0% |