Thai vs Immigrants from Yemen Child Poverty Among Boys Under 16
COMPARE
Thai
Immigrants from Yemen
Child Poverty Among Boys Under 16
Child Poverty Among Boys Under 16 Comparison
Thais
Immigrants from Yemen
11.7%
CHILD POVERTY AMONG BOYS UNDER 16
100.0/ 100
METRIC RATING
4th/ 347
METRIC RANK
28.9%
CHILD POVERTY AMONG BOYS UNDER 16
0.0/ 100
METRIC RATING
341st/ 347
METRIC RANK
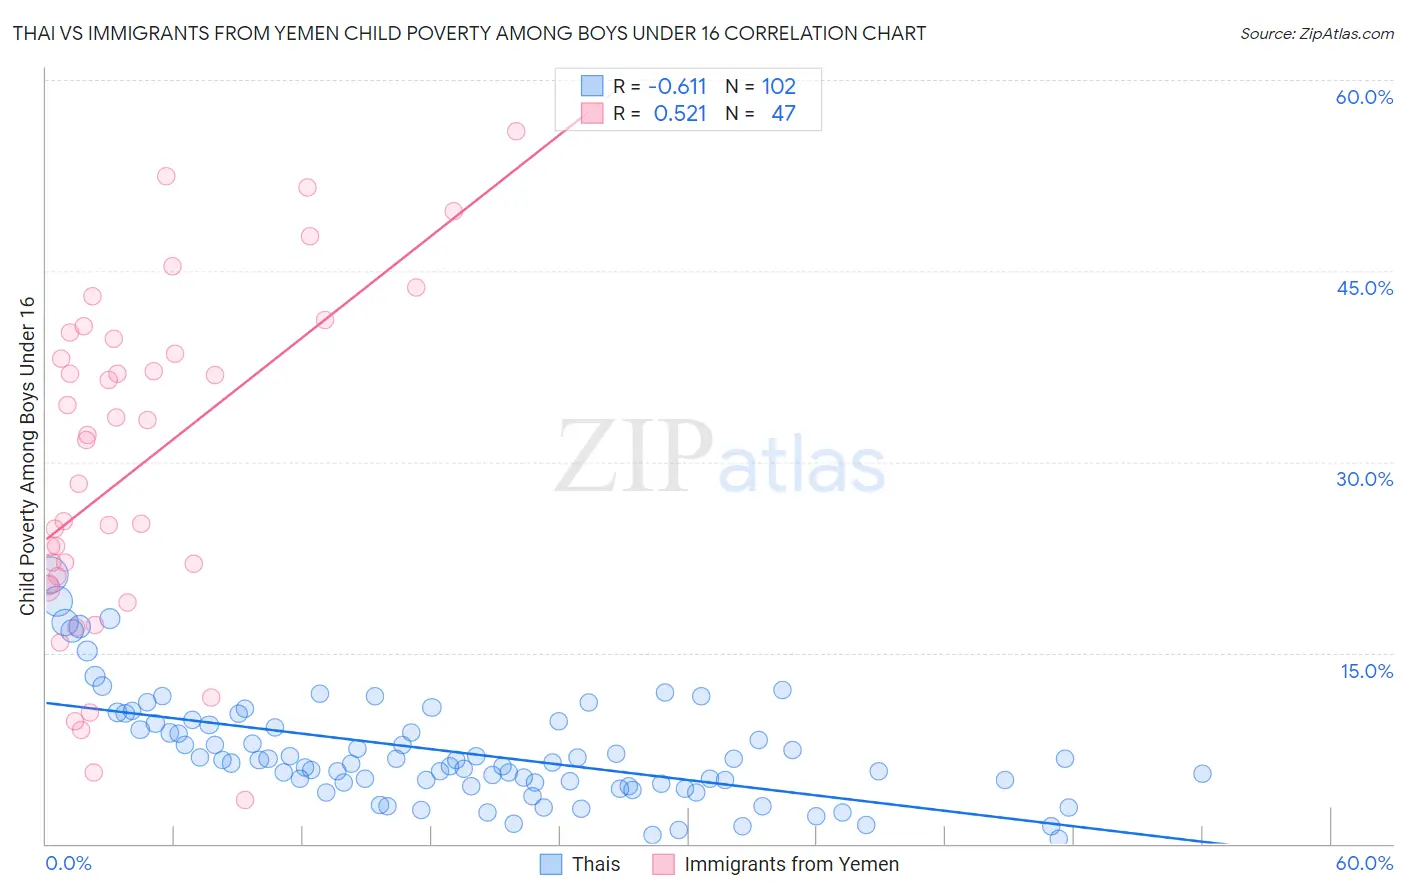
Thai vs Immigrants from Yemen Child Poverty Among Boys Under 16 Correlation Chart
The statistical analysis conducted on geographies consisting of 465,293,416 people shows a significant negative correlation between the proportion of Thais and poverty level among boys under the age of 16 in the United States with a correlation coefficient (R) of -0.611 and weighted average of 11.7%. Similarly, the statistical analysis conducted on geographies consisting of 82,297,858 people shows a substantial positive correlation between the proportion of Immigrants from Yemen and poverty level among boys under the age of 16 in the United States with a correlation coefficient (R) of 0.521 and weighted average of 28.9%, a difference of 147.1%.
Child Poverty Among Boys Under 16 Correlation Summary
| Measurement | Thai | Immigrants from Yemen |
| Minimum | 0.37% | 3.4% |
| Maximum | 21.1% | 55.9% |
| Range | 20.7% | 52.5% |
| Mean | 7.2% | 29.8% |
| Median | 6.4% | 31.7% |
| Interquartile 25% (IQ1) | 4.7% | 20.4% |
| Interquartile 75% (IQ3) | 9.4% | 39.7% |
| Interquartile Range (IQR) | 4.7% | 19.3% |
| Standard Deviation (Sample) | 4.1% | 13.2% |
| Standard Deviation (Population) | 4.1% | 13.0% |
Similar Demographics by Child Poverty Among Boys Under 16
Demographics Similar to Thais by Child Poverty Among Boys Under 16
In terms of child poverty among boys under 16, the demographic groups most similar to Thais are Chinese (11.9%, a difference of 1.6%), Immigrants from Hong Kong (12.3%, a difference of 4.9%), Filipino (11.1%, a difference of 5.1%), Immigrants from Taiwan (11.0%, a difference of 5.9%), and Iranian (12.4%, a difference of 6.6%).
| Demographics | Rating | Rank | Child Poverty Among Boys Under 16 |
| Immigrants | India | 100.0 /100 | #1 | Exceptional 10.9% |
| Immigrants | Taiwan | 100.0 /100 | #2 | Exceptional 11.0% |
| Filipinos | 100.0 /100 | #3 | Exceptional 11.1% |
| Thais | 100.0 /100 | #4 | Exceptional 11.7% |
| Chinese | 100.0 /100 | #5 | Exceptional 11.9% |
| Immigrants | Hong Kong | 100.0 /100 | #6 | Exceptional 12.3% |
| Iranians | 100.0 /100 | #7 | Exceptional 12.4% |
| Immigrants | Singapore | 100.0 /100 | #8 | Exceptional 12.5% |
| Immigrants | Iran | 100.0 /100 | #9 | Exceptional 12.5% |
| Bhutanese | 100.0 /100 | #10 | Exceptional 12.6% |
| Immigrants | South Central Asia | 100.0 /100 | #11 | Exceptional 12.7% |
| Burmese | 99.9 /100 | #12 | Exceptional 13.0% |
| Immigrants | Korea | 99.9 /100 | #13 | Exceptional 13.0% |
| Immigrants | Ireland | 99.9 /100 | #14 | Exceptional 13.1% |
| Immigrants | Japan | 99.9 /100 | #15 | Exceptional 13.1% |
Demographics Similar to Immigrants from Yemen by Child Poverty Among Boys Under 16
In terms of child poverty among boys under 16, the demographic groups most similar to Immigrants from Yemen are Pima (29.7%, a difference of 3.1%), Navajo (30.3%, a difference of 5.0%), Yuman (30.6%, a difference of 6.2%), Tohono O'odham (31.6%, a difference of 9.4%), and Crow (26.3%, a difference of 9.9%).
| Demographics | Rating | Rank | Child Poverty Among Boys Under 16 |
| Apache | 0.0 /100 | #333 | Tragic 24.5% |
| Blacks/African Americans | 0.0 /100 | #334 | Tragic 24.5% |
| Yup'ik | 0.0 /100 | #335 | Tragic 24.7% |
| Sioux | 0.0 /100 | #336 | Tragic 25.3% |
| Cheyenne | 0.0 /100 | #337 | Tragic 25.8% |
| Hopi | 0.0 /100 | #338 | Tragic 25.9% |
| Houma | 0.0 /100 | #339 | Tragic 26.2% |
| Crow | 0.0 /100 | #340 | Tragic 26.3% |
| Immigrants | Yemen | 0.0 /100 | #341 | Tragic 28.9% |
| Pima | 0.0 /100 | #342 | Tragic 29.7% |
| Navajo | 0.0 /100 | #343 | Tragic 30.3% |
| Yuman | 0.0 /100 | #344 | Tragic 30.6% |
| Tohono O'odham | 0.0 /100 | #345 | Tragic 31.6% |
| Lumbee | 0.0 /100 | #346 | Tragic 31.9% |
| Puerto Ricans | 0.0 /100 | #347 | Tragic 32.8% |