Spanish vs British Seniors Poverty Over the Age of 75
COMPARE
Spanish
British
Seniors Poverty Over the Age of 75
Seniors Poverty Over the Age of 75 Comparison
Spanish
British
11.8%
SENIORS POVERTY OVER THE AGE OF 75
80.5/ 100
METRIC RATING
130th/ 347
METRIC RANK
10.7%
SENIORS POVERTY OVER THE AGE OF 75
99.7/ 100
METRIC RATING
32nd/ 347
METRIC RANK
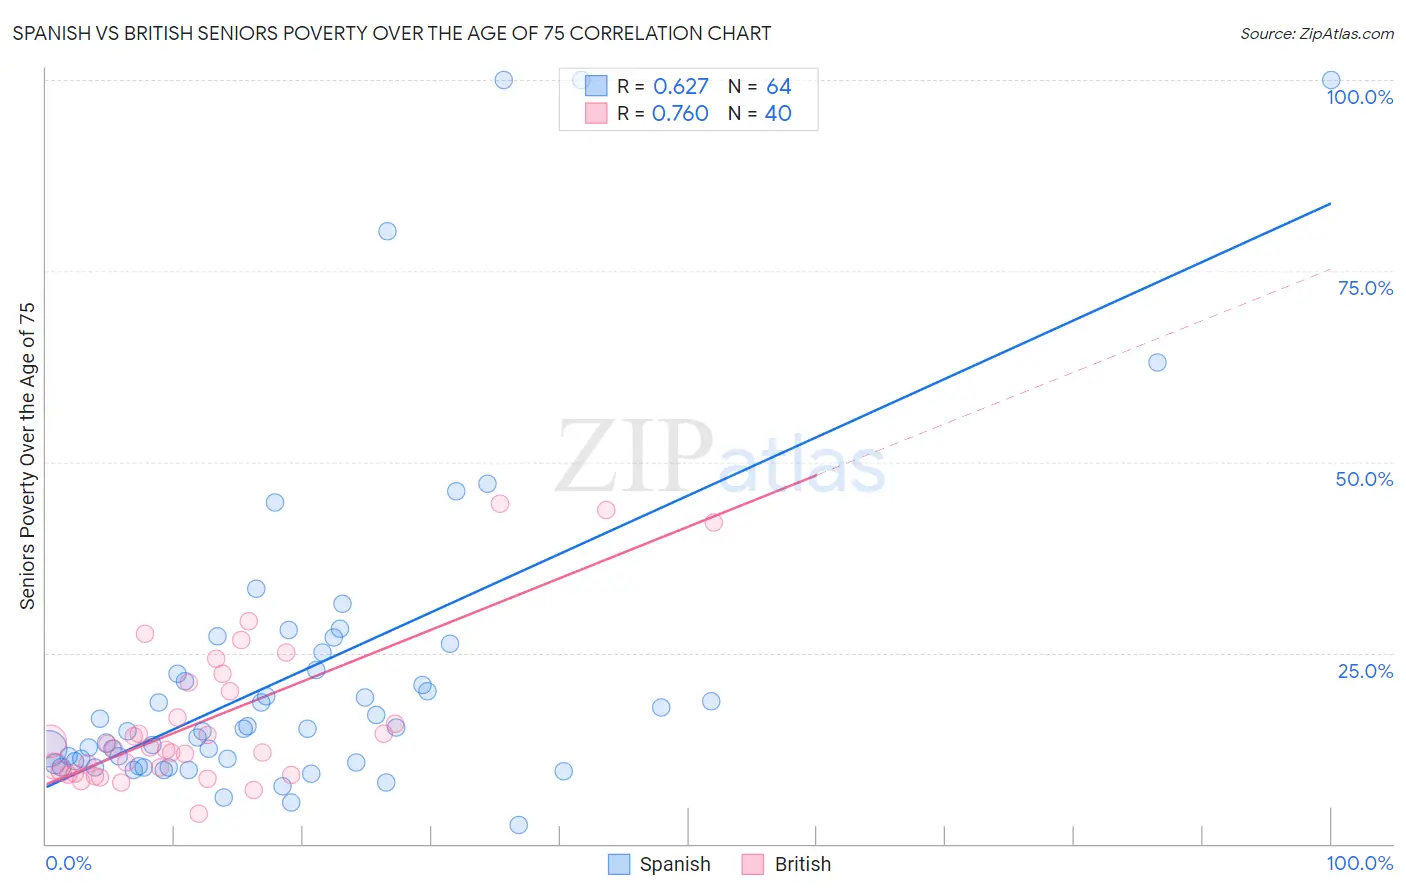
Spanish vs British Seniors Poverty Over the Age of 75 Correlation Chart
The statistical analysis conducted on geographies consisting of 416,617,301 people shows a significant positive correlation between the proportion of Spanish and poverty level among seniors over the age of 75 in the United States with a correlation coefficient (R) of 0.627 and weighted average of 11.8%. Similarly, the statistical analysis conducted on geographies consisting of 519,626,577 people shows a strong positive correlation between the proportion of British and poverty level among seniors over the age of 75 in the United States with a correlation coefficient (R) of 0.760 and weighted average of 10.7%, a difference of 10.2%.
Seniors Poverty Over the Age of 75 Correlation Summary
| Measurement | Spanish | British |
| Minimum | 2.4% | 4.0% |
| Maximum | 100.0% | 44.4% |
| Range | 97.6% | 40.4% |
| Mean | 22.6% | 16.2% |
| Median | 15.1% | 12.6% |
| Interquartile 25% (IQ1) | 10.6% | 9.4% |
| Interquartile 75% (IQ3) | 23.9% | 20.5% |
| Interquartile Range (IQR) | 13.3% | 11.2% |
| Standard Deviation (Sample) | 21.8% | 9.9% |
| Standard Deviation (Population) | 21.7% | 9.8% |
Similar Demographics by Seniors Poverty Over the Age of 75
Demographics Similar to Spanish by Seniors Poverty Over the Age of 75
In terms of seniors poverty over the age of 75, the demographic groups most similar to Spanish are Ethiopian (11.8%, a difference of 0.020%), Immigrants from Western Europe (11.9%, a difference of 0.12%), Immigrants from Hungary (11.8%, a difference of 0.17%), Lebanese (11.9%, a difference of 0.28%), and Immigrants from Denmark (11.8%, a difference of 0.29%).
| Demographics | Rating | Rank | Seniors Poverty Over the Age of 75 |
| Immigrants | Italy | 84.0 /100 | #123 | Excellent 11.8% |
| Fijians | 83.8 /100 | #124 | Excellent 11.8% |
| Sudanese | 83.6 /100 | #125 | Excellent 11.8% |
| Pennsylvania Germans | 83.4 /100 | #126 | Excellent 11.8% |
| Immigrants | Denmark | 82.6 /100 | #127 | Excellent 11.8% |
| Immigrants | Hungary | 81.7 /100 | #128 | Excellent 11.8% |
| Ethiopians | 80.7 /100 | #129 | Excellent 11.8% |
| Spanish | 80.5 /100 | #130 | Excellent 11.8% |
| Immigrants | Western Europe | 79.6 /100 | #131 | Good 11.9% |
| Lebanese | 78.3 /100 | #132 | Good 11.9% |
| Immigrants | Sierra Leone | 77.6 /100 | #133 | Good 11.9% |
| Ugandans | 77.1 /100 | #134 | Good 11.9% |
| Immigrants | Ireland | 76.2 /100 | #135 | Good 11.9% |
| Immigrants | Philippines | 75.0 /100 | #136 | Good 11.9% |
| Immigrants | Moldova | 74.1 /100 | #137 | Good 11.9% |
Demographics Similar to British by Seniors Poverty Over the Age of 75
In terms of seniors poverty over the age of 75, the demographic groups most similar to British are Puget Sound Salish (10.8%, a difference of 0.060%), Italian (10.8%, a difference of 0.11%), Marshallese (10.7%, a difference of 0.14%), Swiss (10.7%, a difference of 0.32%), and Assyrian/Chaldean/Syriac (10.7%, a difference of 0.40%).
| Demographics | Rating | Rank | Seniors Poverty Over the Age of 75 |
| Menominee | 99.8 /100 | #25 | Exceptional 10.6% |
| Bulgarians | 99.8 /100 | #26 | Exceptional 10.7% |
| Northern Europeans | 99.8 /100 | #27 | Exceptional 10.7% |
| Irish | 99.8 /100 | #28 | Exceptional 10.7% |
| Assyrians/Chaldeans/Syriacs | 99.8 /100 | #29 | Exceptional 10.7% |
| Swiss | 99.7 /100 | #30 | Exceptional 10.7% |
| Marshallese | 99.7 /100 | #31 | Exceptional 10.7% |
| British | 99.7 /100 | #32 | Exceptional 10.7% |
| Puget Sound Salish | 99.7 /100 | #33 | Exceptional 10.8% |
| Italians | 99.7 /100 | #34 | Exceptional 10.8% |
| Luxembourgers | 99.6 /100 | #35 | Exceptional 10.8% |
| Scotch-Irish | 99.6 /100 | #36 | Exceptional 10.8% |
| Latvians | 99.6 /100 | #37 | Exceptional 10.8% |
| Finns | 99.6 /100 | #38 | Exceptional 10.8% |
| Czechoslovakians | 99.4 /100 | #39 | Exceptional 10.9% |