Spanish American Indian vs Immigrants from Bosnia and Herzegovina Seniors Poverty Over the Age of 65
COMPARE
Spanish American Indian
Immigrants from Bosnia and Herzegovina
Seniors Poverty Over the Age of 65
Seniors Poverty Over the Age of 65 Comparison
Spanish American Indians
Immigrants from Bosnia and Herzegovina
13.8%
SENIORS POVERTY OVER THE AGE OF 65
0.0/ 100
METRIC RATING
292nd/ 347
METRIC RANK
10.4%
SENIORS POVERTY OVER THE AGE OF 65
90.8/ 100
METRIC RATING
120th/ 347
METRIC RANK
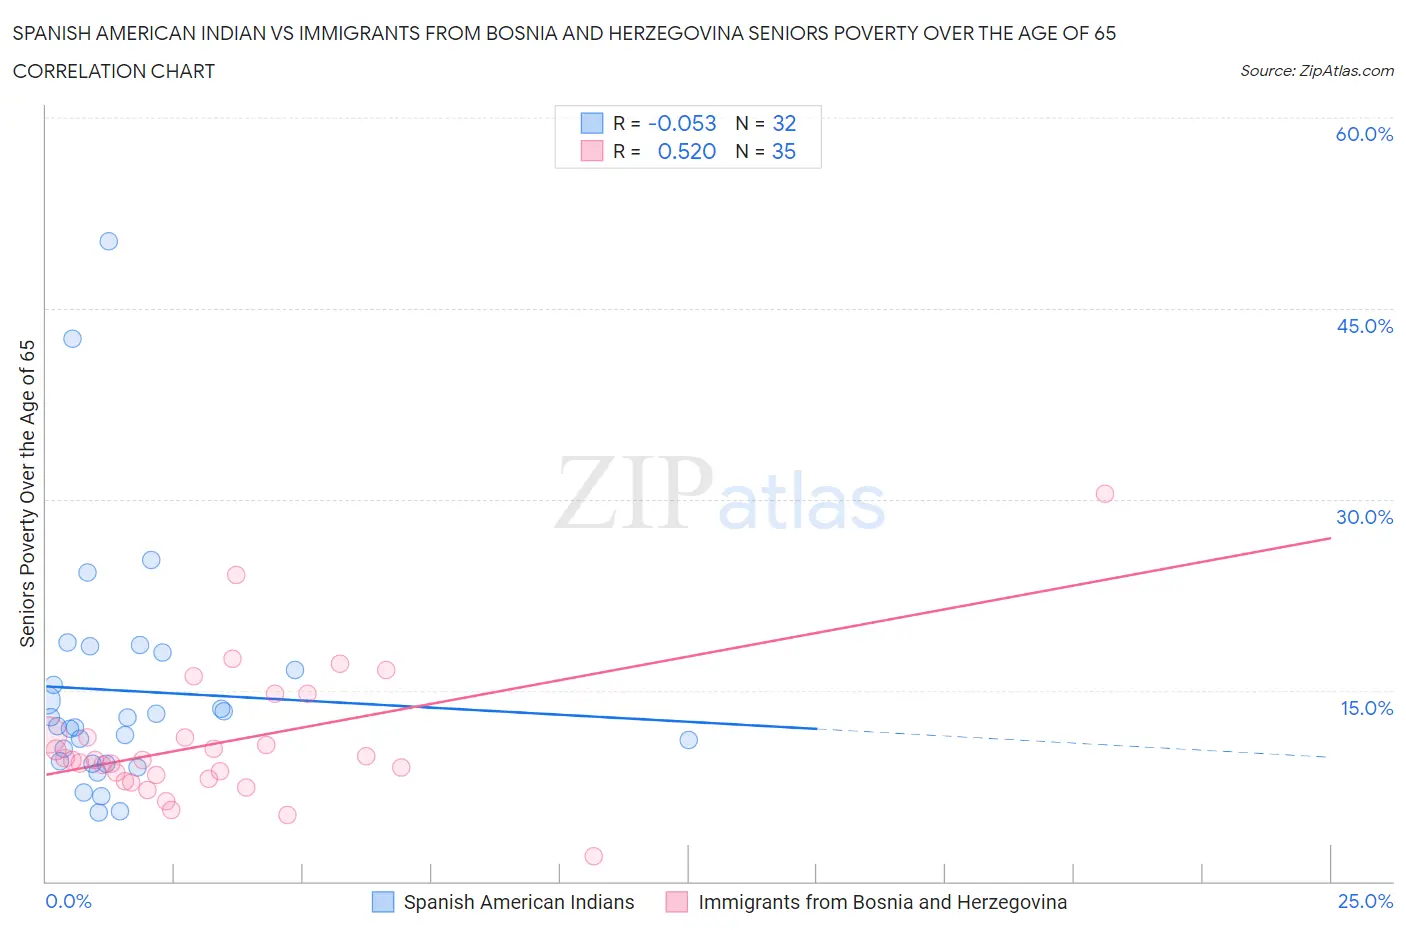
Spanish American Indian vs Immigrants from Bosnia and Herzegovina Seniors Poverty Over the Age of 65 Correlation Chart
The statistical analysis conducted on geographies consisting of 73,118,333 people shows a slight negative correlation between the proportion of Spanish American Indians and poverty level among seniors over the age of 65 in the United States with a correlation coefficient (R) of -0.053 and weighted average of 13.8%. Similarly, the statistical analysis conducted on geographies consisting of 156,713,515 people shows a substantial positive correlation between the proportion of Immigrants from Bosnia and Herzegovina and poverty level among seniors over the age of 65 in the United States with a correlation coefficient (R) of 0.520 and weighted average of 10.4%, a difference of 33.0%.
Seniors Poverty Over the Age of 65 Correlation Summary
| Measurement | Spanish American Indian | Immigrants from Bosnia and Herzegovina |
| Minimum | 5.4% | 1.9% |
| Maximum | 50.3% | 30.4% |
| Range | 44.9% | 28.5% |
| Mean | 15.0% | 11.0% |
| Median | 12.5% | 9.5% |
| Interquartile 25% (IQ1) | 9.3% | 8.0% |
| Interquartile 75% (IQ3) | 17.3% | 11.5% |
| Interquartile Range (IQR) | 8.0% | 3.4% |
| Standard Deviation (Sample) | 9.6% | 5.4% |
| Standard Deviation (Population) | 9.4% | 5.3% |
Similar Demographics by Seniors Poverty Over the Age of 65
Demographics Similar to Spanish American Indians by Seniors Poverty Over the Age of 65
In terms of seniors poverty over the age of 65, the demographic groups most similar to Spanish American Indians are Immigrants from Guatemala (13.8%, a difference of 0.19%), Cheyenne (13.9%, a difference of 0.61%), Black/African American (13.7%, a difference of 0.69%), Apache (13.9%, a difference of 0.79%), and Immigrants from Jamaica (13.9%, a difference of 1.1%).
| Demographics | Rating | Rank | Seniors Poverty Over the Age of 65 |
| Guatemalans | 0.0 /100 | #285 | Tragic 13.5% |
| Immigrants | Senegal | 0.0 /100 | #286 | Tragic 13.6% |
| Immigrants | Mexico | 0.0 /100 | #287 | Tragic 13.6% |
| Belizeans | 0.0 /100 | #288 | Tragic 13.6% |
| Jamaicans | 0.0 /100 | #289 | Tragic 13.6% |
| Immigrants | Central America | 0.0 /100 | #290 | Tragic 13.6% |
| Blacks/African Americans | 0.0 /100 | #291 | Tragic 13.7% |
| Spanish American Indians | 0.0 /100 | #292 | Tragic 13.8% |
| Immigrants | Guatemala | 0.0 /100 | #293 | Tragic 13.8% |
| Cheyenne | 0.0 /100 | #294 | Tragic 13.9% |
| Apache | 0.0 /100 | #295 | Tragic 13.9% |
| Immigrants | Jamaica | 0.0 /100 | #296 | Tragic 13.9% |
| Vietnamese | 0.0 /100 | #297 | Tragic 14.0% |
| Immigrants | Belize | 0.0 /100 | #298 | Tragic 14.0% |
| Ecuadorians | 0.0 /100 | #299 | Tragic 14.0% |
Demographics Similar to Immigrants from Bosnia and Herzegovina by Seniors Poverty Over the Age of 65
In terms of seniors poverty over the age of 65, the demographic groups most similar to Immigrants from Bosnia and Herzegovina are Immigrants from Iraq (10.4%, a difference of 0.040%), Immigrants from Moldova (10.4%, a difference of 0.040%), Immigrants from Western Europe (10.4%, a difference of 0.060%), Hmong (10.4%, a difference of 0.22%), and Asian (10.4%, a difference of 0.25%).
| Demographics | Rating | Rank | Seniors Poverty Over the Age of 65 |
| Immigrants | Romania | 93.3 /100 | #113 | Exceptional 10.3% |
| Immigrants | Denmark | 92.7 /100 | #114 | Exceptional 10.3% |
| Immigrants | Italy | 92.6 /100 | #115 | Exceptional 10.3% |
| Pakistanis | 92.2 /100 | #116 | Exceptional 10.3% |
| Lebanese | 92.0 /100 | #117 | Exceptional 10.3% |
| Okinawans | 91.7 /100 | #118 | Exceptional 10.4% |
| Immigrants | Western Europe | 91.1 /100 | #119 | Exceptional 10.4% |
| Immigrants | Bosnia and Herzegovina | 90.8 /100 | #120 | Exceptional 10.4% |
| Immigrants | Iraq | 90.7 /100 | #121 | Exceptional 10.4% |
| Immigrants | Moldova | 90.7 /100 | #122 | Exceptional 10.4% |
| Hmong | 90.0 /100 | #123 | Exceptional 10.4% |
| Asians | 89.9 /100 | #124 | Excellent 10.4% |
| Immigrants | Philippines | 89.4 /100 | #125 | Excellent 10.4% |
| Immigrants | Hungary | 89.1 /100 | #126 | Excellent 10.4% |
| Cambodians | 89.1 /100 | #127 | Excellent 10.4% |