South American vs Samoan Female Poverty Among 25-34 Year Olds
COMPARE
South American
Samoan
Female Poverty Among 25-34 Year Olds
Female Poverty Among 25-34 Year Olds Comparison
South Americans
Samoans
13.2%
FEMALE POVERTY AMONG 25-34 YEAR OLDS
76.9/ 100
METRIC RATING
146th/ 347
METRIC RANK
13.5%
FEMALE POVERTY AMONG 25-34 YEAR OLDS
56.8/ 100
METRIC RATING
169th/ 347
METRIC RANK
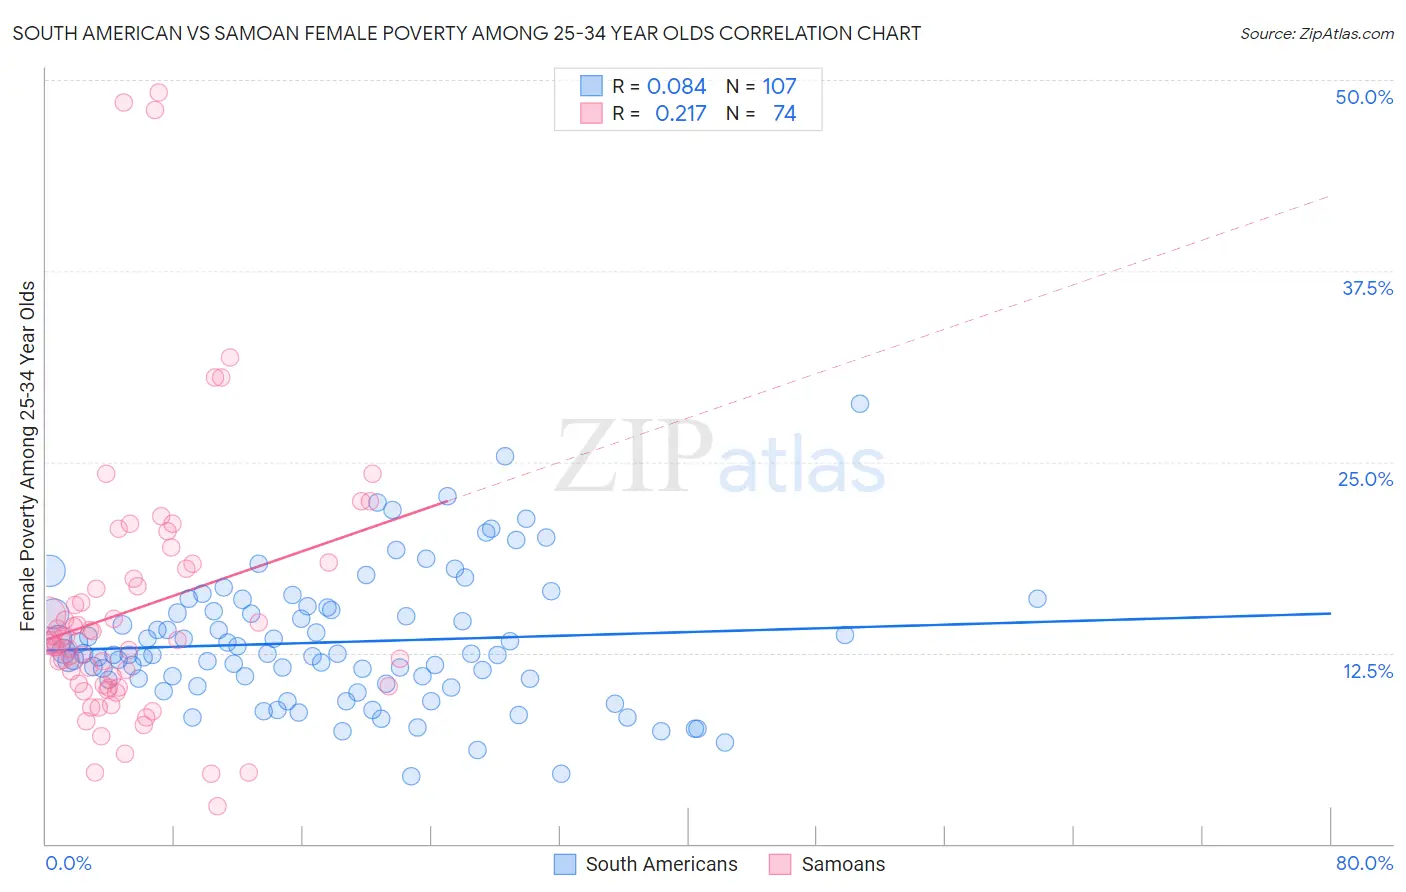
South American vs Samoan Female Poverty Among 25-34 Year Olds Correlation Chart
The statistical analysis conducted on geographies consisting of 482,485,766 people shows a slight positive correlation between the proportion of South Americans and poverty level among females between the ages 25 and 34 in the United States with a correlation coefficient (R) of 0.084 and weighted average of 13.2%. Similarly, the statistical analysis conducted on geographies consisting of 223,994,438 people shows a weak positive correlation between the proportion of Samoans and poverty level among females between the ages 25 and 34 in the United States with a correlation coefficient (R) of 0.217 and weighted average of 13.5%, a difference of 2.0%.
Female Poverty Among 25-34 Year Olds Correlation Summary
| Measurement | South American | Samoan |
| Minimum | 4.4% | 2.5% |
| Maximum | 28.8% | 49.2% |
| Range | 24.4% | 46.7% |
| Mean | 13.2% | 15.4% |
| Median | 12.4% | 13.3% |
| Interquartile 25% (IQ1) | 10.7% | 10.3% |
| Interquartile 75% (IQ3) | 15.3% | 18.0% |
| Interquartile Range (IQR) | 4.6% | 7.7% |
| Standard Deviation (Sample) | 4.3% | 9.0% |
| Standard Deviation (Population) | 4.3% | 8.9% |
Similar Demographics by Female Poverty Among 25-34 Year Olds
Demographics Similar to South Americans by Female Poverty Among 25-34 Year Olds
In terms of female poverty among 25-34 year olds, the demographic groups most similar to South Americans are European (13.2%, a difference of 0.010%), Lebanese (13.2%, a difference of 0.010%), Colombian (13.2%, a difference of 0.040%), Sierra Leonean (13.2%, a difference of 0.080%), and Iraqi (13.2%, a difference of 0.10%).
| Demographics | Rating | Rank | Female Poverty Among 25-34 Year Olds |
| Austrians | 83.7 /100 | #139 | Excellent 13.1% |
| Immigrants | Iraq | 83.6 /100 | #140 | Excellent 13.1% |
| New Zealanders | 83.4 /100 | #141 | Excellent 13.1% |
| Scandinavians | 82.3 /100 | #142 | Excellent 13.1% |
| Israelis | 81.9 /100 | #143 | Excellent 13.1% |
| Native Hawaiians | 78.9 /100 | #144 | Good 13.2% |
| Colombians | 77.2 /100 | #145 | Good 13.2% |
| South Americans | 76.9 /100 | #146 | Good 13.2% |
| Europeans | 76.8 /100 | #147 | Good 13.2% |
| Lebanese | 76.8 /100 | #148 | Good 13.2% |
| Sierra Leoneans | 76.3 /100 | #149 | Good 13.2% |
| Iraqis | 76.0 /100 | #150 | Good 13.2% |
| Costa Ricans | 75.8 /100 | #151 | Good 13.2% |
| Slavs | 75.7 /100 | #152 | Good 13.2% |
| Northern Europeans | 73.7 /100 | #153 | Good 13.2% |
Demographics Similar to Samoans by Female Poverty Among 25-34 Year Olds
In terms of female poverty among 25-34 year olds, the demographic groups most similar to Samoans are Immigrants from Afghanistan (13.4%, a difference of 0.080%), Immigrants from Bosnia and Herzegovina (13.4%, a difference of 0.16%), Belgian (13.4%, a difference of 0.18%), Basque (13.4%, a difference of 0.21%), and Immigrants from Uganda (13.5%, a difference of 0.32%).
| Demographics | Rating | Rank | Female Poverty Among 25-34 Year Olds |
| Ugandans | 64.1 /100 | #162 | Good 13.4% |
| British | 63.5 /100 | #163 | Good 13.4% |
| Swiss | 61.7 /100 | #164 | Good 13.4% |
| Basques | 59.3 /100 | #165 | Average 13.4% |
| Belgians | 58.9 /100 | #166 | Average 13.4% |
| Immigrants | Bosnia and Herzegovina | 58.6 /100 | #167 | Average 13.4% |
| Immigrants | Afghanistan | 57.7 /100 | #168 | Average 13.4% |
| Samoans | 56.8 /100 | #169 | Average 13.5% |
| Immigrants | Uganda | 53.0 /100 | #170 | Average 13.5% |
| South American Indians | 51.9 /100 | #171 | Average 13.5% |
| Immigrants | Costa Rica | 51.9 /100 | #172 | Average 13.5% |
| Kenyans | 51.8 /100 | #173 | Average 13.5% |
| Immigrants | Oceania | 50.0 /100 | #174 | Average 13.5% |
| Bermudans | 46.8 /100 | #175 | Average 13.6% |
| Yugoslavians | 45.0 /100 | #176 | Average 13.6% |