Slovak vs Immigrants from South America Male Poverty
COMPARE
Slovak
Immigrants from South America
Male Poverty
Male Poverty Comparison
Slovaks
Immigrants from South America
10.2%
MALE POVERTY
97.7/ 100
METRIC RATING
63rd/ 347
METRIC RANK
11.3%
MALE POVERTY
36.9/ 100
METRIC RATING
184th/ 347
METRIC RANK
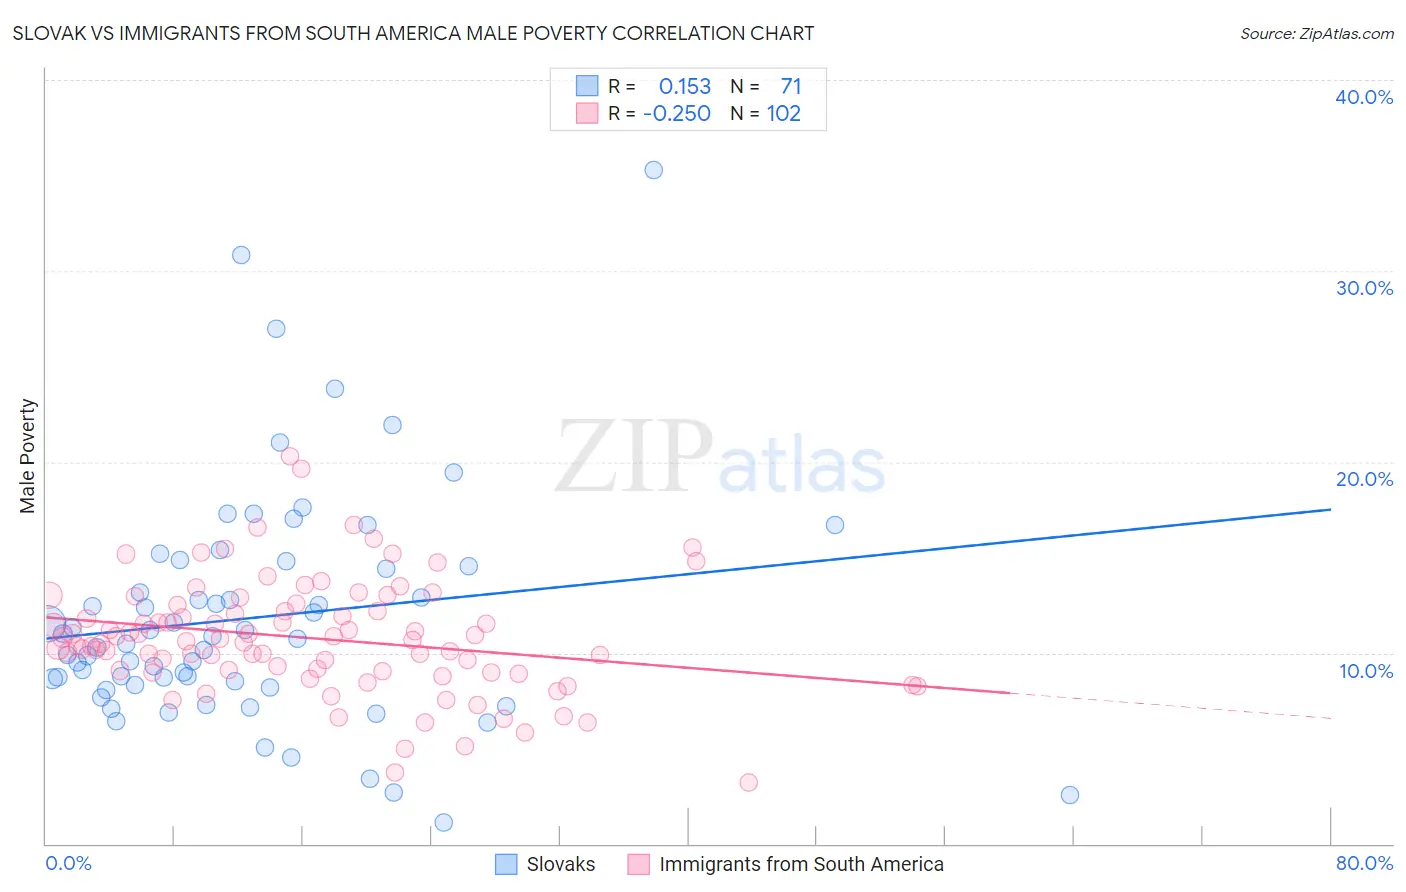
Slovak vs Immigrants from South America Male Poverty Correlation Chart
The statistical analysis conducted on geographies consisting of 397,408,255 people shows a poor positive correlation between the proportion of Slovaks and poverty level among males in the United States with a correlation coefficient (R) of 0.153 and weighted average of 10.2%. Similarly, the statistical analysis conducted on geographies consisting of 485,658,265 people shows a weak negative correlation between the proportion of Immigrants from South America and poverty level among males in the United States with a correlation coefficient (R) of -0.250 and weighted average of 11.3%, a difference of 11.6%.
Male Poverty Correlation Summary
| Measurement | Slovak | Immigrants from South America |
| Minimum | 1.1% | 3.2% |
| Maximum | 35.3% | 20.3% |
| Range | 34.2% | 17.1% |
| Mean | 11.8% | 10.8% |
| Median | 10.7% | 10.6% |
| Interquartile 25% (IQ1) | 8.3% | 9.1% |
| Interquartile 75% (IQ3) | 14.6% | 12.2% |
| Interquartile Range (IQR) | 6.2% | 3.1% |
| Standard Deviation (Sample) | 6.1% | 3.0% |
| Standard Deviation (Population) | 6.0% | 3.0% |
Similar Demographics by Male Poverty
Demographics Similar to Slovaks by Male Poverty
In terms of male poverty, the demographic groups most similar to Slovaks are Immigrants from Italy (10.2%, a difference of 0.040%), Austrian (10.1%, a difference of 0.13%), Ukrainian (10.1%, a difference of 0.15%), Immigrants from Europe (10.1%, a difference of 0.24%), and Swiss (10.2%, a difference of 0.24%).
| Demographics | Rating | Rank | Male Poverty |
| Immigrants | Bulgaria | 98.2 /100 | #56 | Exceptional 10.1% |
| Estonians | 98.1 /100 | #57 | Exceptional 10.1% |
| Scandinavians | 98.0 /100 | #58 | Exceptional 10.1% |
| Immigrants | Europe | 97.9 /100 | #59 | Exceptional 10.1% |
| Ukrainians | 97.9 /100 | #60 | Exceptional 10.1% |
| Austrians | 97.8 /100 | #61 | Exceptional 10.1% |
| Immigrants | Italy | 97.8 /100 | #62 | Exceptional 10.2% |
| Slovaks | 97.7 /100 | #63 | Exceptional 10.2% |
| Swiss | 97.5 /100 | #64 | Exceptional 10.2% |
| Zimbabweans | 97.5 /100 | #65 | Exceptional 10.2% |
| Serbians | 97.5 /100 | #66 | Exceptional 10.2% |
| Immigrants | Netherlands | 97.3 /100 | #67 | Exceptional 10.2% |
| Immigrants | Sri Lanka | 97.2 /100 | #68 | Exceptional 10.2% |
| Immigrants | Australia | 97.1 /100 | #69 | Exceptional 10.2% |
| Paraguayans | 97.1 /100 | #70 | Exceptional 10.2% |
Demographics Similar to Immigrants from South America by Male Poverty
In terms of male poverty, the demographic groups most similar to Immigrants from South America are Kenyan (11.3%, a difference of 0.16%), Mongolian (11.3%, a difference of 0.22%), Immigrants from Costa Rica (11.3%, a difference of 0.27%), Immigrants from Morocco (11.3%, a difference of 0.33%), and Immigrants from Syria (11.3%, a difference of 0.34%).
| Demographics | Rating | Rank | Male Poverty |
| Lebanese | 45.6 /100 | #177 | Average 11.2% |
| Immigrants | Cameroon | 44.5 /100 | #178 | Average 11.2% |
| Immigrants | Syria | 40.3 /100 | #179 | Average 11.3% |
| Immigrants | Morocco | 40.1 /100 | #180 | Average 11.3% |
| Immigrants | Costa Rica | 39.5 /100 | #181 | Fair 11.3% |
| Mongolians | 39.0 /100 | #182 | Fair 11.3% |
| Kenyans | 38.4 /100 | #183 | Fair 11.3% |
| Immigrants | South America | 36.9 /100 | #184 | Fair 11.3% |
| Immigrants | Afghanistan | 33.3 /100 | #185 | Fair 11.4% |
| Immigrants | Sierra Leone | 32.9 /100 | #186 | Fair 11.4% |
| Immigrants | Iraq | 31.9 /100 | #187 | Fair 11.4% |
| Sierra Leoneans | 29.9 /100 | #188 | Fair 11.4% |
| Hawaiians | 28.3 /100 | #189 | Fair 11.4% |
| Israelis | 26.1 /100 | #190 | Fair 11.5% |
| South American Indians | 22.8 /100 | #191 | Fair 11.5% |