Sioux vs Immigrants from Liberia Seniors Poverty Over the Age of 75
COMPARE
Sioux
Immigrants from Liberia
Seniors Poverty Over the Age of 75
Seniors Poverty Over the Age of 75 Comparison
Sioux
Immigrants from Liberia
16.8%
SENIORS POVERTY OVER THE AGE OF 75
0.0/ 100
METRIC RATING
327th/ 347
METRIC RANK
12.8%
SENIORS POVERTY OVER THE AGE OF 75
7.3/ 100
METRIC RATING
209th/ 347
METRIC RANK
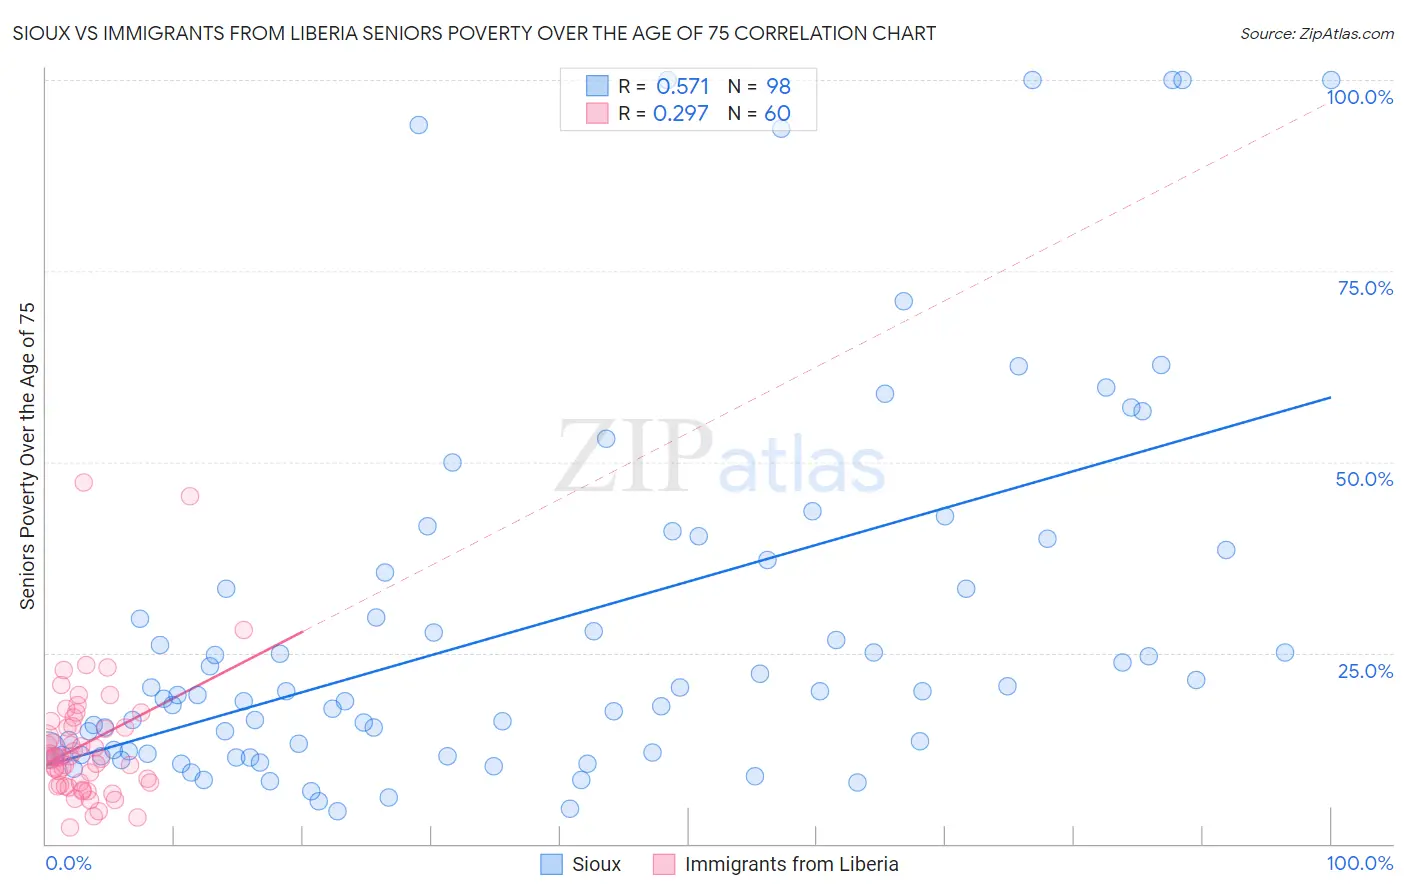
Sioux vs Immigrants from Liberia Seniors Poverty Over the Age of 75 Correlation Chart
The statistical analysis conducted on geographies consisting of 232,175,600 people shows a substantial positive correlation between the proportion of Sioux and poverty level among seniors over the age of 75 in the United States with a correlation coefficient (R) of 0.571 and weighted average of 16.8%. Similarly, the statistical analysis conducted on geographies consisting of 134,606,989 people shows a weak positive correlation between the proportion of Immigrants from Liberia and poverty level among seniors over the age of 75 in the United States with a correlation coefficient (R) of 0.297 and weighted average of 12.8%, a difference of 30.8%.
Seniors Poverty Over the Age of 75 Correlation Summary
| Measurement | Sioux | Immigrants from Liberia |
| Minimum | 4.2% | 2.2% |
| Maximum | 100.0% | 47.3% |
| Range | 95.8% | 45.1% |
| Mean | 28.3% | 13.1% |
| Median | 19.5% | 11.3% |
| Interquartile 25% (IQ1) | 11.8% | 7.8% |
| Interquartile 75% (IQ3) | 35.4% | 15.7% |
| Interquartile Range (IQR) | 23.6% | 7.9% |
| Standard Deviation (Sample) | 24.5% | 8.2% |
| Standard Deviation (Population) | 24.4% | 8.2% |
Similar Demographics by Seniors Poverty Over the Age of 75
Demographics Similar to Sioux by Seniors Poverty Over the Age of 75
In terms of seniors poverty over the age of 75, the demographic groups most similar to Sioux are Cape Verdean (16.8%, a difference of 0.030%), Pueblo (16.7%, a difference of 0.21%), Nicaraguan (16.6%, a difference of 0.91%), Immigrants from Uzbekistan (16.5%, a difference of 1.3%), and Central American Indian (16.5%, a difference of 1.3%).
| Demographics | Rating | Rank | Seniors Poverty Over the Age of 75 |
| Immigrants | Yemen | 0.0 /100 | #320 | Tragic 16.5% |
| Immigrants | Haiti | 0.0 /100 | #321 | Tragic 16.5% |
| Immigrants | Barbados | 0.0 /100 | #322 | Tragic 16.5% |
| Central American Indians | 0.0 /100 | #323 | Tragic 16.5% |
| Immigrants | Uzbekistan | 0.0 /100 | #324 | Tragic 16.5% |
| Nicaraguans | 0.0 /100 | #325 | Tragic 16.6% |
| Pueblo | 0.0 /100 | #326 | Tragic 16.7% |
| Sioux | 0.0 /100 | #327 | Tragic 16.8% |
| Cape Verdeans | 0.0 /100 | #328 | Tragic 16.8% |
| Immigrants | Dominica | 0.0 /100 | #329 | Tragic 17.0% |
| British West Indians | 0.0 /100 | #330 | Tragic 17.4% |
| Immigrants | Armenia | 0.0 /100 | #331 | Tragic 17.5% |
| Immigrants | St. Vincent and the Grenadines | 0.0 /100 | #332 | Tragic 17.5% |
| Immigrants | Nicaragua | 0.0 /100 | #333 | Tragic 17.6% |
| Immigrants | Grenada | 0.0 /100 | #334 | Tragic 17.8% |
Demographics Similar to Immigrants from Liberia by Seniors Poverty Over the Age of 75
In terms of seniors poverty over the age of 75, the demographic groups most similar to Immigrants from Liberia are Comanche (12.8%, a difference of 0.10%), Brazilian (12.8%, a difference of 0.12%), Immigrants from Hong Kong (12.8%, a difference of 0.25%), Immigrants from Eastern Asia (12.8%, a difference of 0.28%), and Costa Rican (12.8%, a difference of 0.36%).
| Demographics | Rating | Rank | Seniors Poverty Over the Age of 75 |
| Arapaho | 10.9 /100 | #202 | Poor 12.7% |
| Immigrants | Southern Europe | 10.7 /100 | #203 | Poor 12.7% |
| Immigrants | Eritrea | 10.5 /100 | #204 | Poor 12.7% |
| Indians (Asian) | 9.7 /100 | #205 | Tragic 12.7% |
| Albanians | 9.6 /100 | #206 | Tragic 12.7% |
| Costa Ricans | 8.7 /100 | #207 | Tragic 12.8% |
| Immigrants | Eastern Asia | 8.4 /100 | #208 | Tragic 12.8% |
| Immigrants | Liberia | 7.3 /100 | #209 | Tragic 12.8% |
| Comanche | 7.0 /100 | #210 | Tragic 12.8% |
| Brazilians | 6.9 /100 | #211 | Tragic 12.8% |
| Immigrants | Hong Kong | 6.5 /100 | #212 | Tragic 12.8% |
| French American Indians | 6.1 /100 | #213 | Tragic 12.9% |
| Immigrants | Africa | 5.9 /100 | #214 | Tragic 12.9% |
| South American Indians | 5.5 /100 | #215 | Tragic 12.9% |
| Immigrants | Brazil | 5.2 /100 | #216 | Tragic 12.9% |