Shoshone vs Mexican American Indian Female Poverty Among 18-24 Year Olds
COMPARE
Shoshone
Mexican American Indian
Female Poverty Among 18-24 Year Olds
Female Poverty Among 18-24 Year Olds Comparison
Shoshone
Mexican American Indians
22.5%
FEMALE POVERTY AMONG 18-24 YEAR OLDS
0.0/ 100
METRIC RATING
295th/ 347
METRIC RANK
20.4%
FEMALE POVERTY AMONG 18-24 YEAR OLDS
23.2/ 100
METRIC RATING
194th/ 347
METRIC RANK
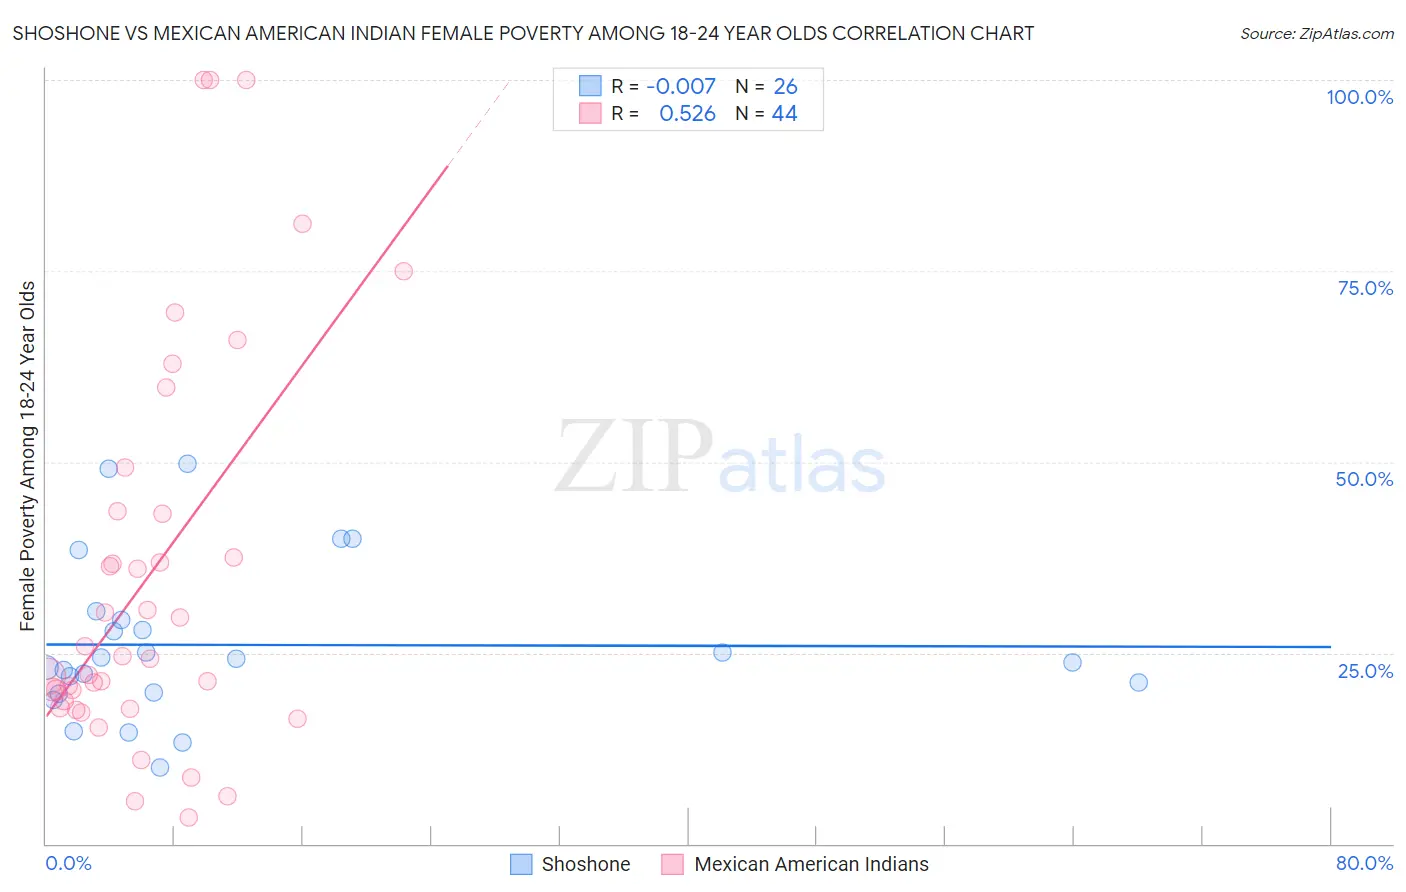
Shoshone vs Mexican American Indian Female Poverty Among 18-24 Year Olds Correlation Chart
The statistical analysis conducted on geographies consisting of 66,235,554 people shows no correlation between the proportion of Shoshone and poverty level among females between the ages 18 and 24 in the United States with a correlation coefficient (R) of -0.007 and weighted average of 22.5%. Similarly, the statistical analysis conducted on geographies consisting of 313,953,450 people shows a substantial positive correlation between the proportion of Mexican American Indians and poverty level among females between the ages 18 and 24 in the United States with a correlation coefficient (R) of 0.526 and weighted average of 20.4%, a difference of 10.4%.
Female Poverty Among 18-24 Year Olds Correlation Summary
| Measurement | Shoshone | Mexican American Indian |
| Minimum | 10.0% | 3.4% |
| Maximum | 49.7% | 100.0% |
| Range | 39.7% | 96.6% |
| Mean | 26.0% | 35.1% |
| Median | 24.0% | 24.4% |
| Interquartile 25% (IQ1) | 19.7% | 18.3% |
| Interquartile 75% (IQ3) | 29.4% | 43.4% |
| Interquartile Range (IQR) | 9.6% | 25.2% |
| Standard Deviation (Sample) | 10.2% | 25.8% |
| Standard Deviation (Population) | 10.0% | 25.5% |
Similar Demographics by Female Poverty Among 18-24 Year Olds
Demographics Similar to Shoshone by Female Poverty Among 18-24 Year Olds
In terms of female poverty among 18-24 year olds, the demographic groups most similar to Shoshone are Menominee (22.5%, a difference of 0.11%), Indonesian (22.5%, a difference of 0.12%), U.S. Virgin Islander (22.5%, a difference of 0.16%), Alaskan Athabascan (22.5%, a difference of 0.19%), and Bangladeshi (22.5%, a difference of 0.24%).
| Demographics | Rating | Rank | Female Poverty Among 18-24 Year Olds |
| Dominicans | 0.0 /100 | #288 | Tragic 22.3% |
| French American Indians | 0.0 /100 | #289 | Tragic 22.3% |
| Immigrants | Senegal | 0.0 /100 | #290 | Tragic 22.4% |
| Bangladeshis | 0.0 /100 | #291 | Tragic 22.5% |
| Alaskan Athabascans | 0.0 /100 | #292 | Tragic 22.5% |
| U.S. Virgin Islanders | 0.0 /100 | #293 | Tragic 22.5% |
| Indonesians | 0.0 /100 | #294 | Tragic 22.5% |
| Shoshone | 0.0 /100 | #295 | Tragic 22.5% |
| Menominee | 0.0 /100 | #296 | Tragic 22.5% |
| Inupiat | 0.0 /100 | #297 | Tragic 22.6% |
| Central American Indians | 0.0 /100 | #298 | Tragic 22.6% |
| Cherokee | 0.0 /100 | #299 | Tragic 22.7% |
| Africans | 0.0 /100 | #300 | Tragic 22.8% |
| Seminole | 0.0 /100 | #301 | Tragic 22.9% |
| Iroquois | 0.0 /100 | #302 | Tragic 22.9% |
Demographics Similar to Mexican American Indians by Female Poverty Among 18-24 Year Olds
In terms of female poverty among 18-24 year olds, the demographic groups most similar to Mexican American Indians are Nigerian (20.4%, a difference of 0.010%), Immigrants from Latvia (20.4%, a difference of 0.010%), Czech (20.4%, a difference of 0.060%), Immigrants from Israel (20.4%, a difference of 0.080%), and Zimbabwean (20.4%, a difference of 0.15%).
| Demographics | Rating | Rank | Female Poverty Among 18-24 Year Olds |
| Immigrants | Mexico | 36.3 /100 | #187 | Fair 20.2% |
| Scandinavians | 34.6 /100 | #188 | Fair 20.3% |
| Immigrants | Germany | 34.0 /100 | #189 | Fair 20.3% |
| Immigrants | Western Asia | 29.3 /100 | #190 | Fair 20.3% |
| Moroccans | 25.8 /100 | #191 | Fair 20.4% |
| Immigrants | Israel | 24.4 /100 | #192 | Fair 20.4% |
| Nigerians | 23.4 /100 | #193 | Fair 20.4% |
| Mexican American Indians | 23.2 /100 | #194 | Fair 20.4% |
| Immigrants | Latvia | 23.0 /100 | #195 | Fair 20.4% |
| Czechs | 22.3 /100 | #196 | Fair 20.4% |
| Zimbabweans | 21.0 /100 | #197 | Fair 20.4% |
| Immigrants | Spain | 20.7 /100 | #198 | Fair 20.4% |
| Germans | 20.6 /100 | #199 | Fair 20.4% |
| Europeans | 19.9 /100 | #200 | Poor 20.4% |
| Mexicans | 18.3 /100 | #201 | Poor 20.5% |