Seminole vs Immigrants from Bahamas Seniors Poverty Over the Age of 75
COMPARE
Seminole
Immigrants from Bahamas
Seniors Poverty Over the Age of 75
Seniors Poverty Over the Age of 75 Comparison
Seminole
Immigrants from Bahamas
12.9%
SENIORS POVERTY OVER THE AGE OF 75
4.5/ 100
METRIC RATING
220th/ 347
METRIC RANK
14.4%
SENIORS POVERTY OVER THE AGE OF 75
0.0/ 100
METRIC RATING
274th/ 347
METRIC RANK
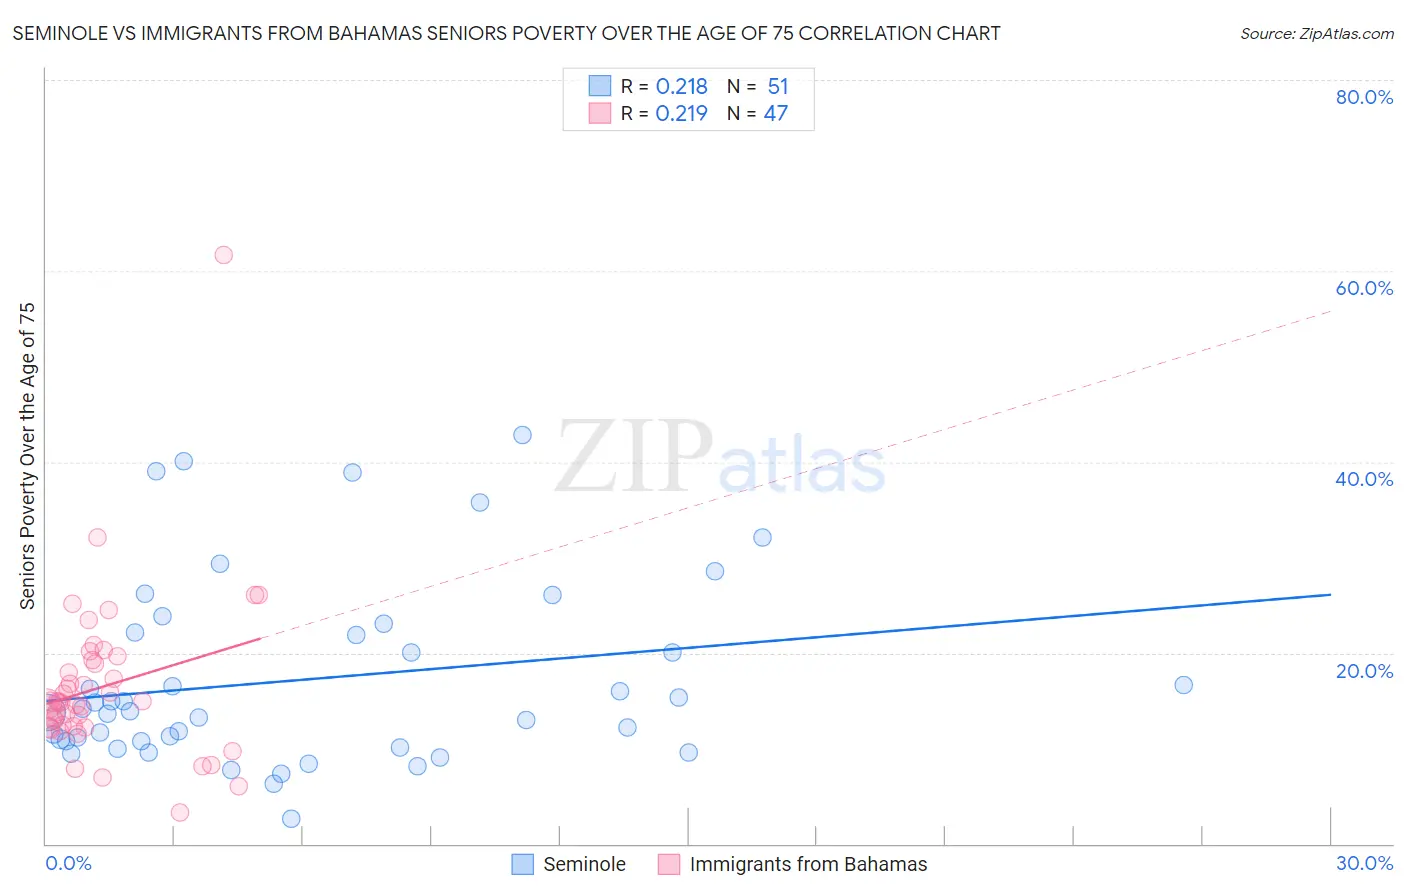
Seminole vs Immigrants from Bahamas Seniors Poverty Over the Age of 75 Correlation Chart
The statistical analysis conducted on geographies consisting of 117,917,932 people shows a weak positive correlation between the proportion of Seminole and poverty level among seniors over the age of 75 in the United States with a correlation coefficient (R) of 0.218 and weighted average of 12.9%. Similarly, the statistical analysis conducted on geographies consisting of 104,312,538 people shows a weak positive correlation between the proportion of Immigrants from Bahamas and poverty level among seniors over the age of 75 in the United States with a correlation coefficient (R) of 0.219 and weighted average of 14.4%, a difference of 11.5%.
Seniors Poverty Over the Age of 75 Correlation Summary
| Measurement | Seminole | Immigrants from Bahamas |
| Minimum | 2.7% | 3.3% |
| Maximum | 42.9% | 61.7% |
| Range | 40.2% | 58.4% |
| Mean | 17.2% | 16.5% |
| Median | 13.9% | 14.8% |
| Interquartile 25% (IQ1) | 10.7% | 12.2% |
| Interquartile 75% (IQ3) | 22.2% | 19.2% |
| Interquartile Range (IQR) | 11.5% | 7.0% |
| Standard Deviation (Sample) | 9.7% | 8.8% |
| Standard Deviation (Population) | 9.6% | 8.7% |
Similar Demographics by Seniors Poverty Over the Age of 75
Demographics Similar to Seminole by Seniors Poverty Over the Age of 75
In terms of seniors poverty over the age of 75, the demographic groups most similar to Seminole are Immigrants from Kazakhstan (13.0%, a difference of 0.090%), Ute (12.9%, a difference of 0.11%), Immigrants from Western Asia (12.9%, a difference of 0.17%), Bermudan (12.9%, a difference of 0.20%), and Immigrants from Brazil (12.9%, a difference of 0.29%).
| Demographics | Rating | Rank | Seniors Poverty Over the Age of 75 |
| French American Indians | 6.1 /100 | #213 | Tragic 12.9% |
| Immigrants | Africa | 5.9 /100 | #214 | Tragic 12.9% |
| South American Indians | 5.5 /100 | #215 | Tragic 12.9% |
| Immigrants | Brazil | 5.2 /100 | #216 | Tragic 12.9% |
| Bermudans | 4.9 /100 | #217 | Tragic 12.9% |
| Immigrants | Western Asia | 4.9 /100 | #218 | Tragic 12.9% |
| Ute | 4.7 /100 | #219 | Tragic 12.9% |
| Seminole | 4.5 /100 | #220 | Tragic 12.9% |
| Immigrants | Kazakhstan | 4.3 /100 | #221 | Tragic 13.0% |
| Nigerians | 3.4 /100 | #222 | Tragic 13.0% |
| Immigrants | Nigeria | 3.3 /100 | #223 | Tragic 13.0% |
| Chippewa | 2.9 /100 | #224 | Tragic 13.1% |
| Immigrants | Morocco | 2.8 /100 | #225 | Tragic 13.1% |
| Shoshone | 2.6 /100 | #226 | Tragic 13.1% |
| Cree | 2.3 /100 | #227 | Tragic 13.1% |
Demographics Similar to Immigrants from Bahamas by Seniors Poverty Over the Age of 75
In terms of seniors poverty over the age of 75, the demographic groups most similar to Immigrants from Bahamas are Immigrants from El Salvador (14.5%, a difference of 0.16%), Immigrants from South America (14.4%, a difference of 0.17%), Soviet Union (14.5%, a difference of 0.21%), Mexican (14.4%, a difference of 0.39%), and Senegalese (14.5%, a difference of 0.49%).
| Demographics | Rating | Rank | Seniors Poverty Over the Age of 75 |
| Venezuelans | 0.0 /100 | #267 | Tragic 14.2% |
| Colombians | 0.0 /100 | #268 | Tragic 14.3% |
| Immigrants | Venezuela | 0.0 /100 | #269 | Tragic 14.3% |
| Immigrants | Uruguay | 0.0 /100 | #270 | Tragic 14.3% |
| Immigrants | Ghana | 0.0 /100 | #271 | Tragic 14.4% |
| Mexicans | 0.0 /100 | #272 | Tragic 14.4% |
| Immigrants | South America | 0.0 /100 | #273 | Tragic 14.4% |
| Immigrants | Bahamas | 0.0 /100 | #274 | Tragic 14.4% |
| Immigrants | El Salvador | 0.0 /100 | #275 | Tragic 14.5% |
| Soviet Union | 0.0 /100 | #276 | Tragic 14.5% |
| Senegalese | 0.0 /100 | #277 | Tragic 14.5% |
| Immigrants | Colombia | 0.0 /100 | #278 | Tragic 14.6% |
| Blacks/African Americans | 0.0 /100 | #279 | Tragic 14.6% |
| Central Americans | 0.0 /100 | #280 | Tragic 14.7% |
| Belizeans | 0.0 /100 | #281 | Tragic 14.8% |