Seminole vs Crow Seniors Poverty Over the Age of 65
COMPARE
Seminole
Crow
Seniors Poverty Over the Age of 65
Seniors Poverty Over the Age of 65 Comparison
Seminole
Crow
12.0%
SENIORS POVERTY OVER THE AGE OF 65
1.1/ 100
METRIC RATING
238th/ 347
METRIC RANK
15.2%
SENIORS POVERTY OVER THE AGE OF 65
0.0/ 100
METRIC RATING
327th/ 347
METRIC RANK
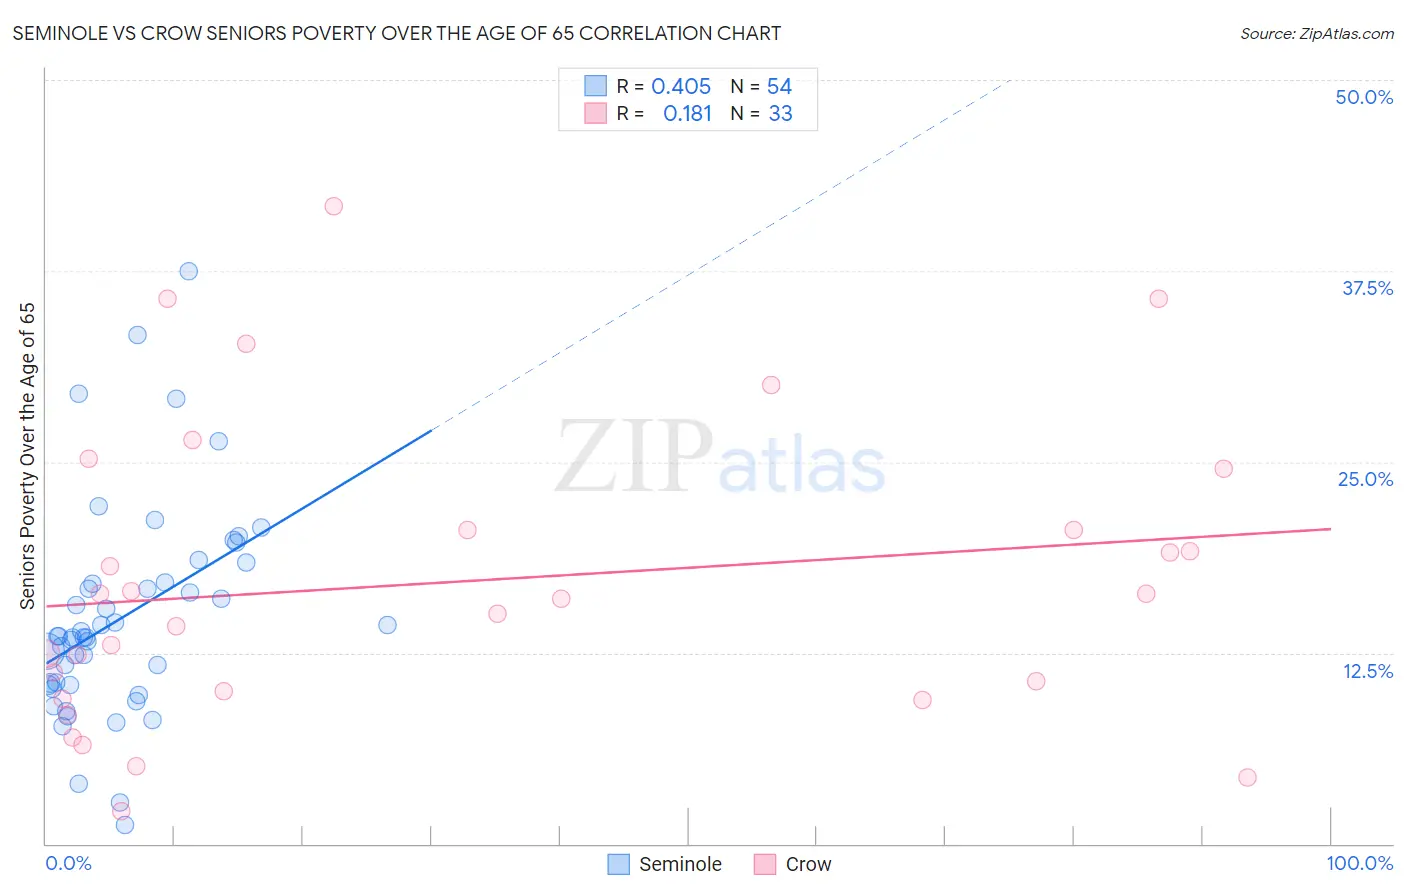
Seminole vs Crow Seniors Poverty Over the Age of 65 Correlation Chart
The statistical analysis conducted on geographies consisting of 118,189,112 people shows a moderate positive correlation between the proportion of Seminole and poverty level among seniors over the age of 65 in the United States with a correlation coefficient (R) of 0.405 and weighted average of 12.0%. Similarly, the statistical analysis conducted on geographies consisting of 59,133,191 people shows a poor positive correlation between the proportion of Crow and poverty level among seniors over the age of 65 in the United States with a correlation coefficient (R) of 0.181 and weighted average of 15.2%, a difference of 26.6%.
Seniors Poverty Over the Age of 65 Correlation Summary
| Measurement | Seminole | Crow |
| Minimum | 1.2% | 2.1% |
| Maximum | 37.5% | 41.7% |
| Range | 36.3% | 39.6% |
| Mean | 14.8% | 17.2% |
| Median | 13.5% | 16.1% |
| Interquartile 25% (IQ1) | 10.4% | 9.8% |
| Interquartile 75% (IQ3) | 17.1% | 22.6% |
| Interquartile Range (IQR) | 6.7% | 12.8% |
| Standard Deviation (Sample) | 7.0% | 9.8% |
| Standard Deviation (Population) | 6.9% | 9.7% |
Similar Demographics by Seniors Poverty Over the Age of 65
Demographics Similar to Seminole by Seniors Poverty Over the Age of 65
In terms of seniors poverty over the age of 65, the demographic groups most similar to Seminole are Moroccan (12.0%, a difference of 0.21%), Immigrants from Spain (12.1%, a difference of 0.26%), Comanche (12.1%, a difference of 0.36%), Immigrants from Peru (12.0%, a difference of 0.37%), and Immigrants from Albania (12.1%, a difference of 0.39%).
| Demographics | Rating | Rank | Seniors Poverty Over the Age of 65 |
| Cajuns | 2.0 /100 | #231 | Tragic 11.9% |
| Yaqui | 1.9 /100 | #232 | Tragic 11.9% |
| Panamanians | 1.8 /100 | #233 | Tragic 11.9% |
| Iroquois | 1.7 /100 | #234 | Tragic 11.9% |
| Immigrants | Argentina | 1.3 /100 | #235 | Tragic 12.0% |
| Immigrants | Peru | 1.3 /100 | #236 | Tragic 12.0% |
| Moroccans | 1.2 /100 | #237 | Tragic 12.0% |
| Seminole | 1.1 /100 | #238 | Tragic 12.0% |
| Immigrants | Spain | 1.0 /100 | #239 | Tragic 12.1% |
| Comanche | 0.9 /100 | #240 | Tragic 12.1% |
| Immigrants | Albania | 0.9 /100 | #241 | Tragic 12.1% |
| Sub-Saharan Africans | 0.9 /100 | #242 | Tragic 12.1% |
| Uruguayans | 0.8 /100 | #243 | Tragic 12.1% |
| Immigrants | Portugal | 0.8 /100 | #244 | Tragic 12.1% |
| Chippewa | 0.7 /100 | #245 | Tragic 12.1% |
Demographics Similar to Crow by Seniors Poverty Over the Age of 65
In terms of seniors poverty over the age of 65, the demographic groups most similar to Crow are Immigrants from Armenia (15.2%, a difference of 0.25%), Sioux (15.3%, a difference of 0.54%), Central American Indian (15.1%, a difference of 0.86%), Nicaraguan (15.0%, a difference of 1.5%), and Immigrants from Dominica (15.5%, a difference of 1.6%).
| Demographics | Rating | Rank | Seniors Poverty Over the Age of 65 |
| Immigrants | Haiti | 0.0 /100 | #320 | Tragic 14.7% |
| Houma | 0.0 /100 | #321 | Tragic 14.7% |
| Immigrants | Barbados | 0.0 /100 | #322 | Tragic 14.8% |
| Yakama | 0.0 /100 | #323 | Tragic 14.8% |
| Nicaraguans | 0.0 /100 | #324 | Tragic 15.0% |
| Central American Indians | 0.0 /100 | #325 | Tragic 15.1% |
| Immigrants | Armenia | 0.0 /100 | #326 | Tragic 15.2% |
| Crow | 0.0 /100 | #327 | Tragic 15.2% |
| Sioux | 0.0 /100 | #328 | Tragic 15.3% |
| Immigrants | Dominica | 0.0 /100 | #329 | Tragic 15.5% |
| Immigrants | St. Vincent and the Grenadines | 0.0 /100 | #330 | Tragic 15.5% |
| British West Indians | 0.0 /100 | #331 | Tragic 15.6% |
| Immigrants | Grenada | 0.0 /100 | #332 | Tragic 15.8% |
| Immigrants | Yemen | 0.0 /100 | #333 | Tragic 15.9% |
| Immigrants | Nicaragua | 0.0 /100 | #334 | Tragic 15.9% |