Potawatomi vs Venezuelan Seniors Poverty Over the Age of 75

COMPARE

Potawatomi
Race
Ancestry
AfghanAfricanAlaska NativeAlaskan AthabascanAlbanianAleutAlsatianAmericanApacheArabArapahoArgentineanArmenianAssyrian/Chaldean/SyriacAustralianAustrianBahamianBangladeshiBarbadianBasqueBelgianBelizeanBermudanBhutaneseBlackfeetBolivianBrazilianBritishBritish West IndianBulgarianBurmeseCajunCambodianCanadianCape VerdeanCarpatho RusynCelticCentral AmericanCentral American IndianCherokeeCheyenneChickasawChileanChineseChippewaChoctawColombianColvilleComancheCosta RicanCreeCreekCroatianCrowCubanCypriotCzechCzechoslovakianDanishDelawareDominicanDutchDutch West IndianEastern EuropeanEcuadorianEgyptianEnglishEstonianEthiopianEuropeanFijianFilipinoFinnishFrenchFrench American IndianFrench CanadianGermanGerman RussianGhanaianGreekGuamanian/ChamorroGuatemalanGuyaneseHaitianHmongHonduranHopiHoumaHungarianIcelanderIndian (Asian)IndonesianInupiatIranianIraqiIrishIroquoisIsraeliItalianJamaicanJapaneseJordanianKenyanKiowaKoreanLaotianLatvianLebaneseLiberianLithuanianLumbeeLuxembourgerMacedonianMalaysianMalteseMarshalleseMenomineeMexicanMexican American IndianMongolianMoroccanNative HawaiianNavajoNepaleseNew ZealanderNicaraguanNigerianNorthern EuropeanNorwegianOkinawanOsageOttawaPaiutePakistaniPalestinianPanamanianParaguayanPennsylvania GermanPeruvianPimaPolishPortuguesePotawatomiPuebloPuerto RicanPuget Sound SalishRomanianRussianSalvadoranSamoanScandinavianScotch-IrishScottishSeminoleSenegaleseSerbianShoshoneSierra LeoneanSiouxSlavicSlovakSloveneSomaliSouth AfricanSouth AmericanSouth American IndianSoviet UnionSpaniardSpanishSpanish AmericanSpanish American IndianSri LankanSubsaharan AfricanSudaneseSwedishSwissSyrianTaiwaneseThaiTlingit-HaidaTohono O'OdhamTonganTrinidadian and TobagonianTsimshianTurkishU.S. Virgin IslanderUgandanUkrainianUruguayanUteVietnameseWelshWest IndianYakamaYaquiYugoslavianYumanYup'ikZimbabwean
Immigration
NonimmigrantsImmigrantsAfghanistanAfricaAlbaniaArgentinaArmeniaAsiaAustraliaAustriaBahamasBangladeshBarbadosBelarusBelgiumBelizeBoliviaBosnia and HerzegovinaBrazilBulgariaBurma/MyanmarCabo VerdeCambodiaCameroonCanadaCaribbeanCentral AmericaChileChinaColombiaCongoCosta RicaCroatiaCubaCzechoslovakiaDenmarkDominicaDominican RepublicEastern AfricaEastern AsiaEastern EuropeEcuadorEgyptEl SalvadorEnglandEritreaEthiopiaEuropeFijiFranceGermanyGhanaGreeceGrenadaGuatemalaGuyanaHaitiHondurasHong KongHungaryIndiaIndonesiaIranIraqIrelandIsraelItalyJamaicaJapanJordanKazakhstanKenyaKoreaKuwaitLaosLatin AmericaLatviaLebanonLiberiaLithuaniaMalaysiaMexicoMicronesiaMiddle AfricaMoldovaMoroccoNepalNetherlandsNicaraguaNigeriaNorth AmericaNorth MacedoniaNorthern AfricaNorthern EuropeNorwayOceaniaPakistanPanamaPeruPhilippinesPolandPortugalRomaniaRussiaSaudi ArabiaScotlandSenegalSerbiaSierra LeoneSingaporeSomaliaSouth AfricaSouth AmericaSouth Central AsiaSouth Eastern AsiaSouthern EuropeSpainSri LankaSt. Vincent and the GrenadinesSudanSwedenSwitzerlandSyriaTaiwanThailandTrinidad and TobagoTurkeyUgandaUkraineUruguayUzbekistanVenezuelaVietnamWest IndiesWestern AfricaWestern AsiaWestern EuropeYemenZaireZimbabweAzores
Venezuelan
Race
Ancestry
AfghanAfricanAlaska NativeAlaskan AthabascanAlbanianAleutAlsatianAmericanApacheArabArapahoArgentineanArmenianAssyrian/Chaldean/SyriacAustralianAustrianBahamianBangladeshiBarbadianBasqueBelgianBelizeanBermudanBhutaneseBlackfeetBolivianBrazilianBritishBritish West IndianBulgarianBurmeseCajunCambodianCanadianCape VerdeanCarpatho RusynCelticCentral AmericanCentral American IndianCherokeeCheyenneChickasawChileanChineseChippewaChoctawColombianColvilleComancheCosta RicanCreeCreekCroatianCrowCubanCypriotCzechCzechoslovakianDanishDelawareDominicanDutchDutch West IndianEastern EuropeanEcuadorianEgyptianEnglishEstonianEthiopianEuropeanFijianFilipinoFinnishFrenchFrench American IndianFrench CanadianGermanGerman RussianGhanaianGreekGuamanian/ChamorroGuatemalanGuyaneseHaitianHmongHonduranHopiHoumaHungarianIcelanderIndian (Asian)IndonesianInupiatIranianIraqiIrishIroquoisIsraeliItalianJamaicanJapaneseJordanianKenyanKiowaKoreanLaotianLatvianLebaneseLiberianLithuanianLumbeeLuxembourgerMacedonianMalaysianMalteseMarshalleseMenomineeMexicanMexican American IndianMongolianMoroccanNative HawaiianNavajoNepaleseNew ZealanderNicaraguanNigerianNorthern EuropeanNorwegianOkinawanOsageOttawaPaiutePakistaniPalestinianPanamanianParaguayanPennsylvania GermanPeruvianPimaPolishPortuguesePuebloPuerto RicanPuget Sound SalishRomanianRussianSalvadoranSamoanScandinavianScotch-IrishScottishSeminoleSenegaleseSerbianShoshoneSierra LeoneanSiouxSlavicSlovakSloveneSomaliSouth AfricanSouth AmericanSouth American IndianSoviet UnionSpaniardSpanishSpanish AmericanSpanish American IndianSri LankanSubsaharan AfricanSudaneseSwedishSwissSyrianTaiwaneseThaiTlingit-HaidaTohono O'OdhamTonganTrinidadian and TobagonianTsimshianTurkishU.S. Virgin IslanderUgandanUkrainianUruguayanUteVenezuelanVietnameseWelshWest IndianYakamaYaquiYugoslavianYumanYup'ikZimbabwean
Immigration
NonimmigrantsImmigrantsAfghanistanAfricaAlbaniaArgentinaArmeniaAsiaAustraliaAustriaBahamasBangladeshBarbadosBelarusBelgiumBelizeBoliviaBosnia and HerzegovinaBrazilBulgariaBurma/MyanmarCabo VerdeCambodiaCameroonCanadaCaribbeanCentral AmericaChileChinaColombiaCongoCosta RicaCroatiaCubaCzechoslovakiaDenmarkDominicaDominican RepublicEastern AfricaEastern AsiaEastern EuropeEcuadorEgyptEl SalvadorEnglandEritreaEthiopiaEuropeFijiFranceGermanyGhanaGreeceGrenadaGuatemalaGuyanaHaitiHondurasHong KongHungaryIndiaIndonesiaIranIraqIrelandIsraelItalyJamaicaJapanJordanKazakhstanKenyaKoreaKuwaitLaosLatin AmericaLatviaLebanonLiberiaLithuaniaMalaysiaMexicoMicronesiaMiddle AfricaMoldovaMoroccoNepalNetherlandsNicaraguaNigeriaNorth AmericaNorth MacedoniaNorthern AfricaNorthern EuropeNorwayOceaniaPakistanPanamaPeruPhilippinesPolandPortugalRomaniaRussiaSaudi ArabiaScotlandSenegalSerbiaSierra LeoneSingaporeSomaliaSouth AfricaSouth AmericaSouth Central AsiaSouth Eastern AsiaSouthern EuropeSpainSri LankaSt. Vincent and the GrenadinesSudanSwedenSwitzerlandSyriaTaiwanThailandTrinidad and TobagoTurkeyUgandaUkraineUruguayUzbekistanVenezuelaVietnamWest IndiesWestern AfricaWestern AsiaWestern EuropeYemenZaireZimbabweAzores
Seniors Poverty Over the Age of 75
Income
Poverty
Unemployment
Labor Participation
Family Structure
Vehicle Availability
Education Level
Disability

Seniors Poverty Over the Age of 75 Comparison

Potawatomi

Venezuelans

Average
Tragic
12.1%
SENIORS POVERTY OVER THE AGE OF 75
57.4/ 100
METRIC RATING
164th/ 347
METRIC RANK
14.2%
SENIORS POVERTY OVER THE AGE OF 75
0.0/ 100
METRIC RATING
267th/ 347
METRIC RANK

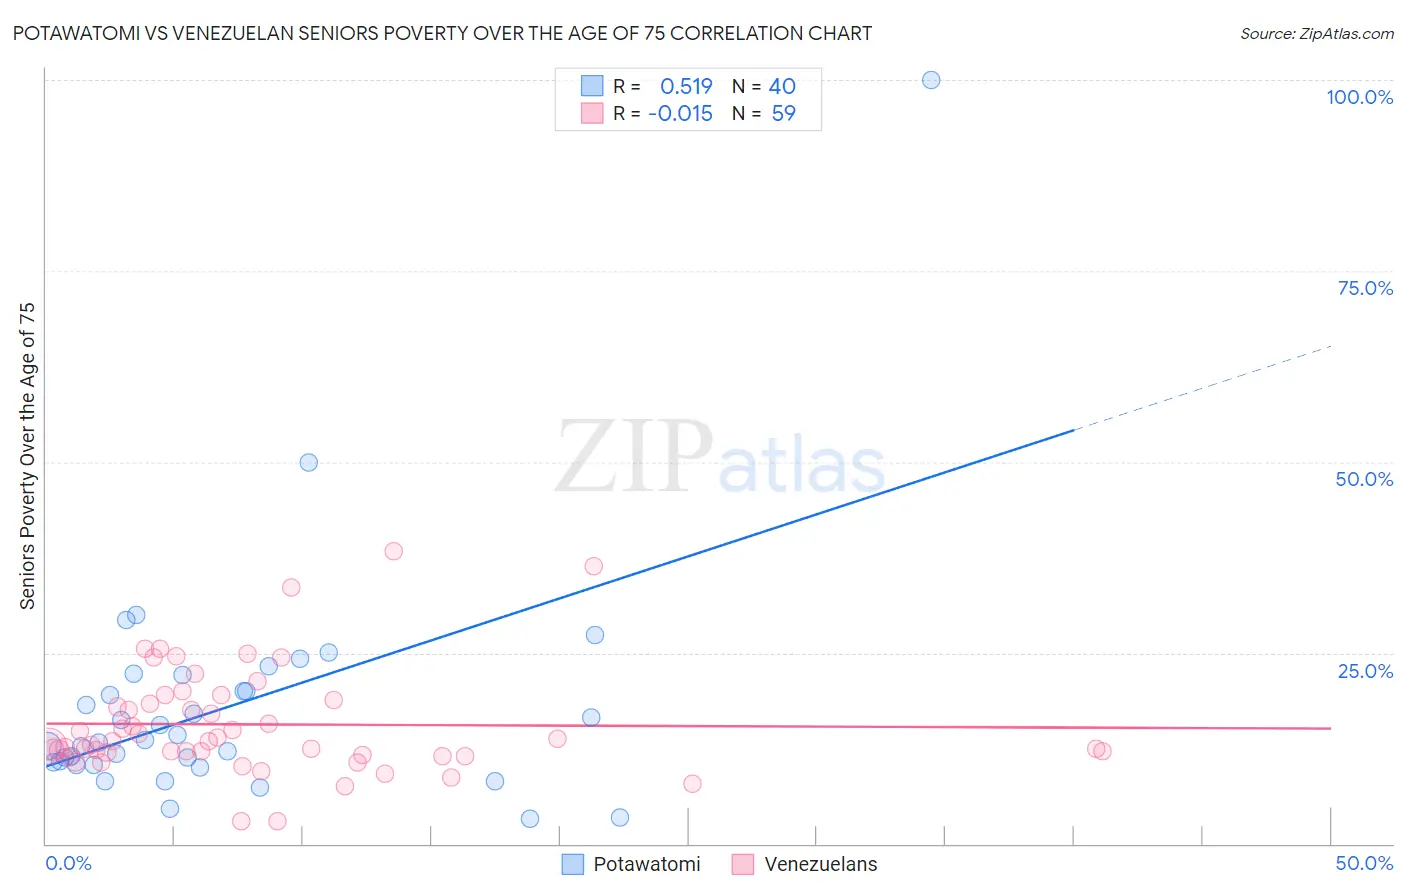
Potawatomi vs Venezuelan Seniors Poverty Over the Age of 75 Correlation Chart

The statistical analysis conducted on geographies consisting of 117,390,328 people shows a substantial positive correlation between the proportion of Potawatomi and poverty level among seniors over the age of 75 in the United States with a correlation coefficient (R) of 0.519 and weighted average of 12.1%. Similarly, the statistical analysis conducted on geographies consisting of 303,492,801 people shows no correlation between the proportion of Venezuelans and poverty level among seniors over the age of 75 in the United States with a correlation coefficient (R) of -0.015 and weighted average of 14.2%, a difference of 17.3%.
Potawatomi vs Venezuelan Seniors Poverty Over the Age of 75

Seniors Poverty Over the Age of 75 Correlation Summary

MeasurementPotawatomiVenezuelan
Minimum3.3%2.9%
Maximum100.0%38.4%
Range96.7%35.4%
Mean17.9%15.6%
Median13.4%13.5%
Interquartile 25% (IQ1)10.5%11.6%
Interquartile 75% (IQ3)21.1%18.8%
Interquartile Range (IQR)10.6%7.1%
Standard Deviation (Sample)15.9%7.0%
Standard Deviation (Population)15.7%7.0%

Similar Demographics by Seniors Poverty Over the Age of 75

Demographics Similar to Potawatomi by Seniors Poverty Over the Age of 75

In terms of seniors poverty over the age of 75, the demographic groups most similar to Potawatomi are Immigrants from Greece (12.1%, a difference of 0.070%), Okinawan (12.1%, a difference of 0.090%), Egyptian (12.1%, a difference of 0.21%), Immigrants from Switzerland (12.1%, a difference of 0.23%), and Immigrants from Serbia (12.1%, a difference of 0.24%).
DemographicsRating | RankSeniors Poverty Over the Age of 75
Immigrants | Sudan
61.7
/100
|
#157
Good
12.1%
Portuguese
61.3
/100
|
#158
Good
12.1%
Immigrants | Middle Africa
61.2
/100
|
#159
Good
12.1%
Immigrants | Eastern Africa
60.9
/100
|
#160
Good
12.1%
Immigrants | Norway
60.6
/100
|
#161
Good
12.1%
Immigrants | Serbia
60.2
/100
|
#162
Good
12.1%
Immigrants | Greece
58.2
/100
|
#163
Average
12.1%
Potawatomi
57.4
/100
|
#164
Average
12.1%
Okinawans
56.3
/100
|
#165
Average
12.1%
Egyptians
54.8
/100
|
#166
Average
12.1%
Immigrants | Switzerland
54.5
/100
|
#167
Average
12.1%
Immigrants | Syria
53.9
/100
|
#168
Average
12.2%
Immigrants | Egypt
53.7
/100
|
#169
Average
12.2%
Immigrants | Thailand
52.0
/100
|
#170
Average
12.2%
Spaniards
51.6
/100
|
#171
Average
12.2%

Demographics Similar to Venezuelans by Seniors Poverty Over the Age of 75

In terms of seniors poverty over the age of 75, the demographic groups most similar to Venezuelans are Armenian (14.2%, a difference of 0.020%), Salvadoran (14.2%, a difference of 0.24%), Colombian (14.3%, a difference of 0.35%), Immigrants from Venezuela (14.3%, a difference of 0.46%), and South American (14.1%, a difference of 0.48%).
DemographicsRating | RankSeniors Poverty Over the Age of 75
Immigrants | Immigrants
0.1
/100
|
#260
Tragic
13.9%
Ghanaians
0.1
/100
|
#261
Tragic
14.0%
Cajuns
0.1
/100
|
#262
Tragic
14.0%
Iroquois
0.1
/100
|
#263
Tragic
14.0%
South Americans
0.0
/100
|
#264
Tragic
14.1%
Salvadorans
0.0
/100
|
#265
Tragic
14.2%
Armenians
0.0
/100
|
#266
Tragic
14.2%
Venezuelans
0.0
/100
|
#267
Tragic
14.2%
Colombians
0.0
/100
|
#268
Tragic
14.3%
Immigrants | Venezuela
0.0
/100
|
#269
Tragic
14.3%
Immigrants | Uruguay
0.0
/100
|
#270
Tragic
14.3%
Immigrants | Ghana
0.0
/100
|
#271
Tragic
14.4%
Mexicans
0.0
/100
|
#272
Tragic
14.4%
Immigrants | South America
0.0
/100
|
#273
Tragic
14.4%
Immigrants | Bahamas
0.0
/100
|
#274
Tragic
14.4%