Pima vs Paraguayan Single Father Poverty
COMPARE
Pima
Paraguayan
Single Father Poverty
Single Father Poverty Comparison
Pima
Paraguayans
14.8%
SINGLE FATHER POVERTY
100.0/ 100
METRIC RATING
40th/ 347
METRIC RANK
15.2%
SINGLE FATHER POVERTY
99.7/ 100
METRIC RATING
67th/ 347
METRIC RANK
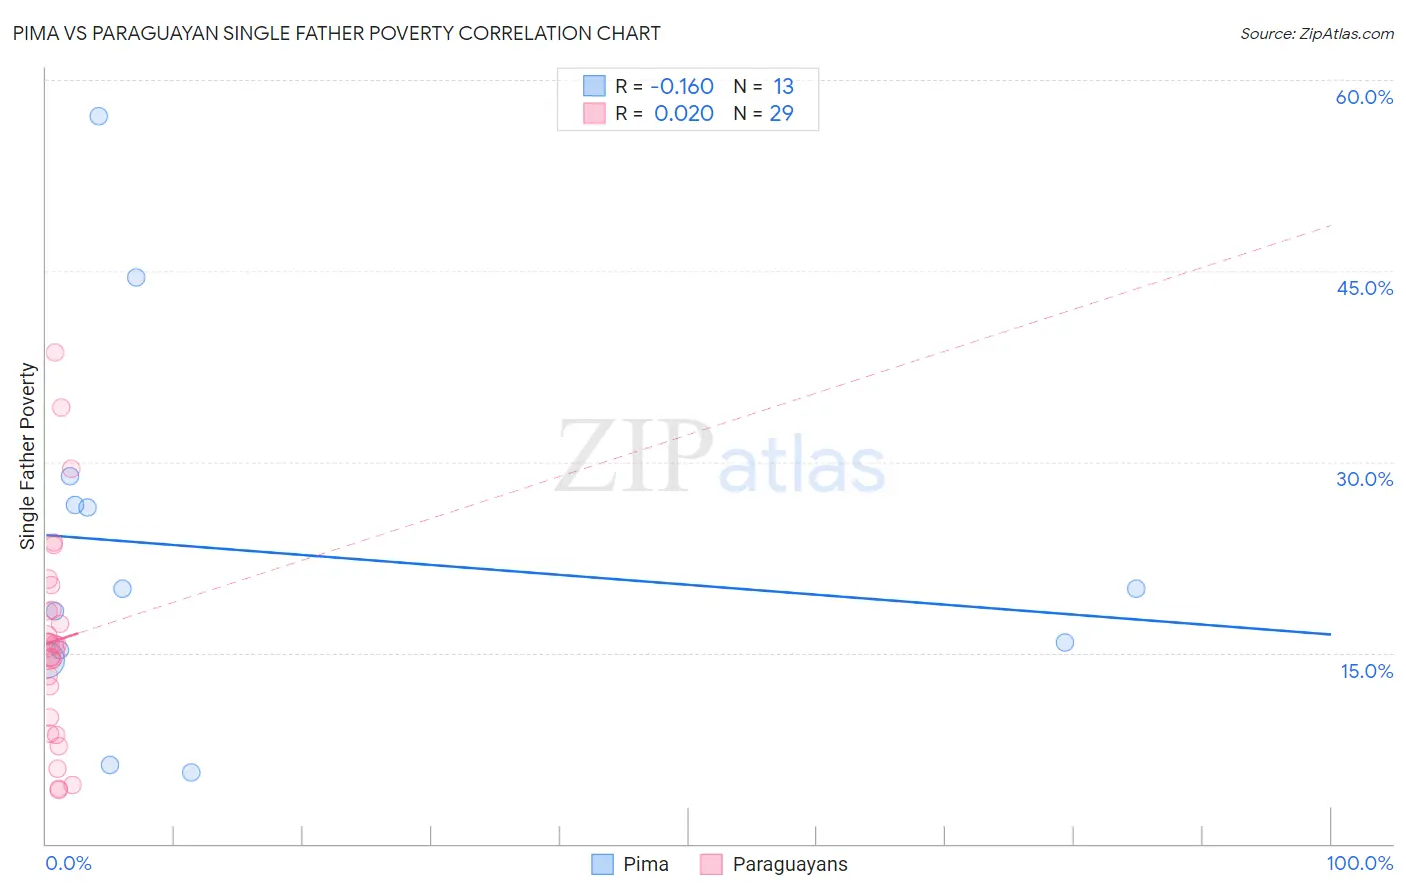
Pima vs Paraguayan Single Father Poverty Correlation Chart
The statistical analysis conducted on geographies consisting of 58,926,282 people shows a poor negative correlation between the proportion of Pima and poverty level among single fathers in the United States with a correlation coefficient (R) of -0.160 and weighted average of 14.8%. Similarly, the statistical analysis conducted on geographies consisting of 86,793,016 people shows no correlation between the proportion of Paraguayans and poverty level among single fathers in the United States with a correlation coefficient (R) of 0.020 and weighted average of 15.2%, a difference of 3.1%.
Single Father Poverty Correlation Summary
| Measurement | Pima | Paraguayan |
| Minimum | 5.6% | 4.2% |
| Maximum | 57.1% | 38.6% |
| Range | 51.6% | 34.4% |
| Mean | 23.0% | 15.9% |
| Median | 20.0% | 15.6% |
| Interquartile 25% (IQ1) | 14.9% | 9.3% |
| Interquartile 75% (IQ3) | 27.7% | 19.4% |
| Interquartile Range (IQR) | 12.9% | 10.1% |
| Standard Deviation (Sample) | 14.4% | 8.3% |
| Standard Deviation (Population) | 13.9% | 8.2% |
Similar Demographics by Single Father Poverty
Demographics Similar to Pima by Single Father Poverty
In terms of single father poverty, the demographic groups most similar to Pima are Indian (Asian) (14.8%, a difference of 0.17%), Immigrants from Nepal (14.8%, a difference of 0.17%), Immigrants from Asia (14.7%, a difference of 0.20%), Immigrants from Eritrea (14.8%, a difference of 0.21%), and Bolivian (14.7%, a difference of 0.37%).
| Demographics | Rating | Rank | Single Father Poverty |
| Okinawans | 100.0 /100 | #33 | Exceptional 14.6% |
| Egyptians | 100.0 /100 | #34 | Exceptional 14.7% |
| Immigrants | Bolivia | 100.0 /100 | #35 | Exceptional 14.7% |
| Immigrants | Indonesia | 100.0 /100 | #36 | Exceptional 14.7% |
| Immigrants | Eastern Africa | 100.0 /100 | #37 | Exceptional 14.7% |
| Bolivians | 100.0 /100 | #38 | Exceptional 14.7% |
| Immigrants | Asia | 100.0 /100 | #39 | Exceptional 14.7% |
| Pima | 100.0 /100 | #40 | Exceptional 14.8% |
| Indians (Asian) | 100.0 /100 | #41 | Exceptional 14.8% |
| Immigrants | Nepal | 100.0 /100 | #42 | Exceptional 14.8% |
| Immigrants | Eritrea | 100.0 /100 | #43 | Exceptional 14.8% |
| Salvadorans | 100.0 /100 | #44 | Exceptional 14.9% |
| Immigrants | Somalia | 100.0 /100 | #45 | Exceptional 14.9% |
| Immigrants | Cambodia | 99.9 /100 | #46 | Exceptional 14.9% |
| Immigrants | China | 99.9 /100 | #47 | Exceptional 14.9% |
Demographics Similar to Paraguayans by Single Father Poverty
In terms of single father poverty, the demographic groups most similar to Paraguayans are Immigrants from Moldova (15.2%, a difference of 0.090%), Immigrants from Cameroon (15.2%, a difference of 0.090%), Immigrants from Malaysia (15.2%, a difference of 0.11%), Japanese (15.2%, a difference of 0.11%), and Bangladeshi (15.2%, a difference of 0.20%).
| Demographics | Rating | Rank | Single Father Poverty |
| Puget Sound Salish | 99.8 /100 | #60 | Exceptional 15.2% |
| Immigrants | Bosnia and Herzegovina | 99.8 /100 | #61 | Exceptional 15.2% |
| Immigrants | Armenia | 99.8 /100 | #62 | Exceptional 15.2% |
| Immigrants | Sweden | 99.8 /100 | #63 | Exceptional 15.2% |
| Bangladeshis | 99.8 /100 | #64 | Exceptional 15.2% |
| Immigrants | Malaysia | 99.8 /100 | #65 | Exceptional 15.2% |
| Immigrants | Moldova | 99.8 /100 | #66 | Exceptional 15.2% |
| Paraguayans | 99.7 /100 | #67 | Exceptional 15.2% |
| Immigrants | Cameroon | 99.7 /100 | #68 | Exceptional 15.2% |
| Japanese | 99.7 /100 | #69 | Exceptional 15.2% |
| Mongolians | 99.7 /100 | #70 | Exceptional 15.3% |
| Immigrants | Brazil | 99.6 /100 | #71 | Exceptional 15.3% |
| Immigrants | Lithuania | 99.6 /100 | #72 | Exceptional 15.3% |
| Kenyans | 99.6 /100 | #73 | Exceptional 15.3% |
| Maltese | 99.6 /100 | #74 | Exceptional 15.3% |