Pennsylvania German vs Immigrants from Zaire Child Poverty Under the Age of 16
COMPARE
Pennsylvania German
Immigrants from Zaire
Child Poverty Under the Age of 16
Child Poverty Under the Age of 16 Comparison
Pennsylvania Germans
Immigrants from Zaire
17.4%
CHILD POVERTY UNDER THE AGE OF 16
7.5/ 100
METRIC RATING
208th/ 347
METRIC RANK
20.1%
CHILD POVERTY UNDER THE AGE OF 16
0.0/ 100
METRIC RATING
283rd/ 347
METRIC RANK
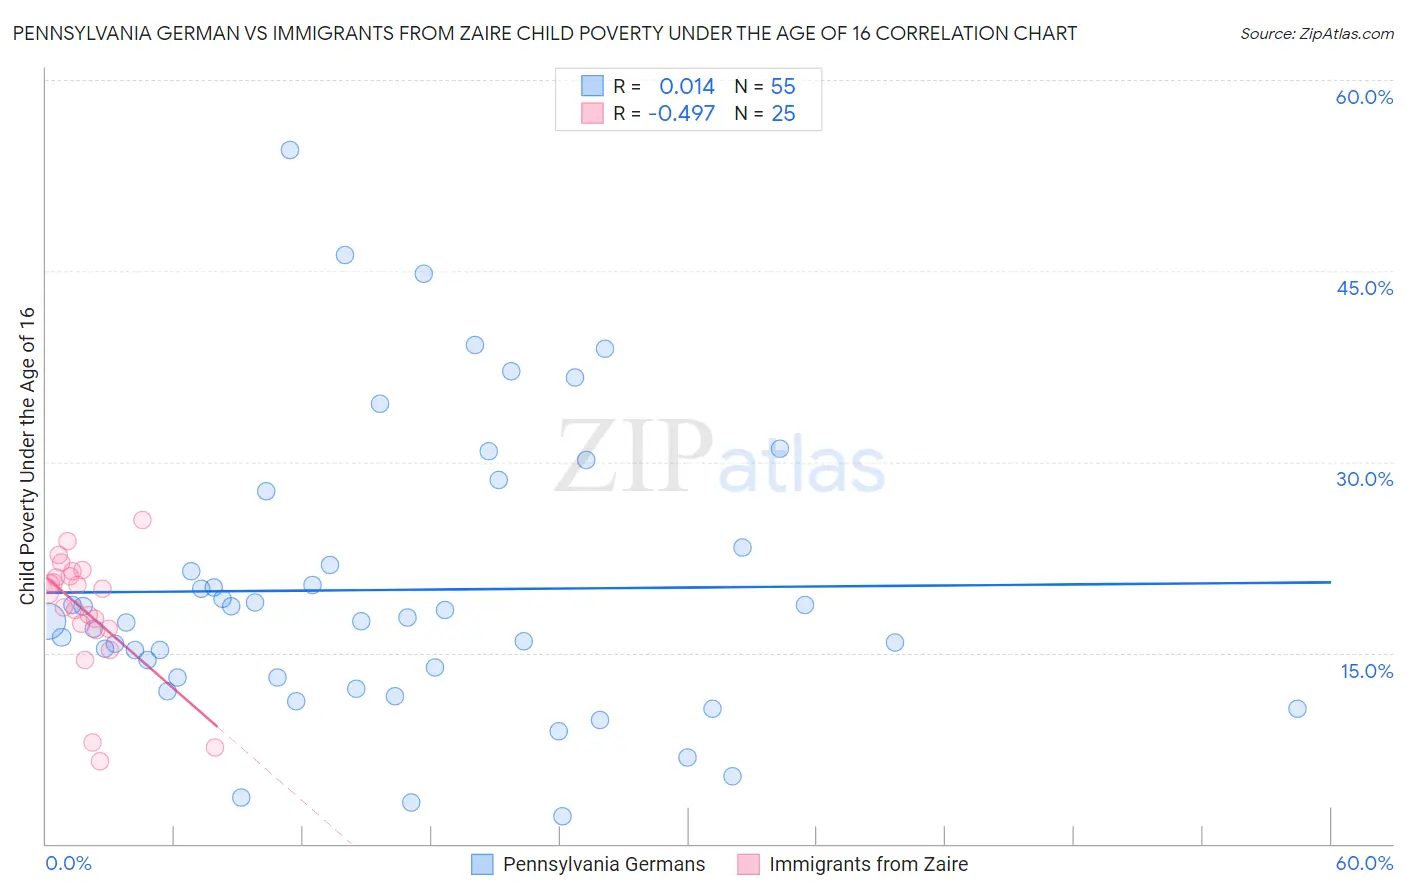
Pennsylvania German vs Immigrants from Zaire Child Poverty Under the Age of 16 Correlation Chart
The statistical analysis conducted on geographies consisting of 232,153,334 people shows no correlation between the proportion of Pennsylvania Germans and poverty level among children under the age of 16 in the United States with a correlation coefficient (R) of 0.014 and weighted average of 17.4%. Similarly, the statistical analysis conducted on geographies consisting of 107,166,496 people shows a moderate negative correlation between the proportion of Immigrants from Zaire and poverty level among children under the age of 16 in the United States with a correlation coefficient (R) of -0.497 and weighted average of 20.1%, a difference of 15.3%.
Child Poverty Under the Age of 16 Correlation Summary
| Measurement | Pennsylvania German | Immigrants from Zaire |
| Minimum | 2.1% | 6.5% |
| Maximum | 54.5% | 25.4% |
| Range | 52.4% | 18.9% |
| Mean | 19.9% | 18.2% |
| Median | 17.5% | 19.9% |
| Interquartile 25% (IQ1) | 13.0% | 16.8% |
| Interquartile 75% (IQ3) | 23.3% | 21.2% |
| Interquartile Range (IQR) | 10.2% | 4.4% |
| Standard Deviation (Sample) | 11.2% | 4.8% |
| Standard Deviation (Population) | 11.1% | 4.7% |
Similar Demographics by Child Poverty Under the Age of 16
Demographics Similar to Pennsylvania Germans by Child Poverty Under the Age of 16
In terms of child poverty under the age of 16, the demographic groups most similar to Pennsylvania Germans are Panamanian (17.5%, a difference of 0.25%), Alaskan Athabascan (17.5%, a difference of 0.27%), Immigrants from Thailand (17.5%, a difference of 0.39%), German Russian (17.4%, a difference of 0.40%), and Immigrants (17.5%, a difference of 0.42%).
| Demographics | Rating | Rank | Child Poverty Under the Age of 16 |
| Immigrants | Uzbekistan | 14.7 /100 | #201 | Poor 17.1% |
| Ugandans | 14.3 /100 | #202 | Poor 17.1% |
| Immigrants | Sierra Leone | 14.2 /100 | #203 | Poor 17.1% |
| Hmong | 14.0 /100 | #204 | Poor 17.1% |
| Aleuts | 13.9 /100 | #205 | Poor 17.1% |
| Alaska Natives | 11.8 /100 | #206 | Poor 17.2% |
| German Russians | 8.6 /100 | #207 | Tragic 17.4% |
| Pennsylvania Germans | 7.5 /100 | #208 | Tragic 17.4% |
| Panamanians | 6.9 /100 | #209 | Tragic 17.5% |
| Alaskan Athabascans | 6.9 /100 | #210 | Tragic 17.5% |
| Immigrants | Thailand | 6.6 /100 | #211 | Tragic 17.5% |
| Immigrants | Immigrants | 6.5 /100 | #212 | Tragic 17.5% |
| Immigrants | Azores | 6.2 /100 | #213 | Tragic 17.5% |
| Iraqis | 5.9 /100 | #214 | Tragic 17.5% |
| Malaysians | 5.9 /100 | #215 | Tragic 17.5% |
Demographics Similar to Immigrants from Zaire by Child Poverty Under the Age of 16
In terms of child poverty under the age of 16, the demographic groups most similar to Immigrants from Zaire are West Indian (20.1%, a difference of 0.14%), Immigrants from St. Vincent and the Grenadines (20.1%, a difference of 0.21%), Barbadian (20.0%, a difference of 0.23%), Central American (20.0%, a difference of 0.26%), and Immigrants from West Indies (20.2%, a difference of 0.35%).
| Demographics | Rating | Rank | Child Poverty Under the Age of 16 |
| Belizeans | 0.1 /100 | #276 | Tragic 19.9% |
| Iroquois | 0.1 /100 | #277 | Tragic 19.9% |
| Bangladeshis | 0.0 /100 | #278 | Tragic 19.9% |
| Sub-Saharan Africans | 0.0 /100 | #279 | Tragic 19.9% |
| Comanche | 0.0 /100 | #280 | Tragic 19.9% |
| Central Americans | 0.0 /100 | #281 | Tragic 20.0% |
| Barbadians | 0.0 /100 | #282 | Tragic 20.0% |
| Immigrants | Zaire | 0.0 /100 | #283 | Tragic 20.1% |
| West Indians | 0.0 /100 | #284 | Tragic 20.1% |
| Immigrants | St. Vincent and the Grenadines | 0.0 /100 | #285 | Tragic 20.1% |
| Immigrants | West Indies | 0.0 /100 | #286 | Tragic 20.2% |
| Blackfeet | 0.0 /100 | #287 | Tragic 20.2% |
| Immigrants | Belize | 0.0 /100 | #288 | Tragic 20.3% |
| Senegalese | 0.0 /100 | #289 | Tragic 20.4% |
| Yaqui | 0.0 /100 | #290 | Tragic 20.4% |