Pakistani vs Immigrants from Europe Seniors Poverty Over the Age of 75
COMPARE
Pakistani
Immigrants from Europe
Seniors Poverty Over the Age of 75
Seniors Poverty Over the Age of 75 Comparison
Pakistanis
Immigrants from Europe
11.8%
SENIORS POVERTY OVER THE AGE OF 75
84.0/ 100
METRIC RATING
122nd/ 347
METRIC RANK
12.2%
SENIORS POVERTY OVER THE AGE OF 75
50.0/ 100
METRIC RATING
174th/ 347
METRIC RANK
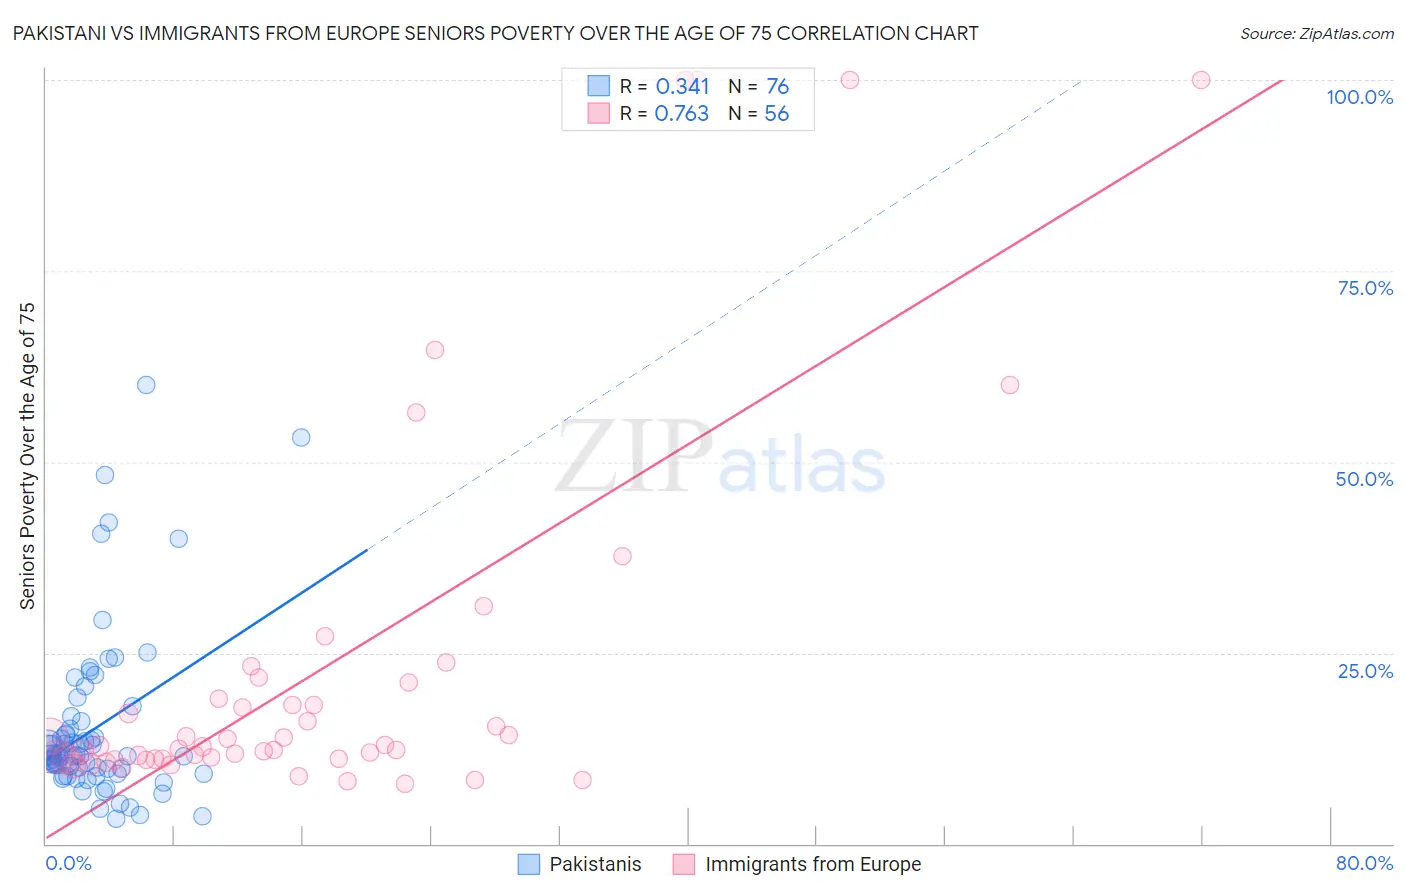
Pakistani vs Immigrants from Europe Seniors Poverty Over the Age of 75 Correlation Chart
The statistical analysis conducted on geographies consisting of 332,247,947 people shows a mild positive correlation between the proportion of Pakistanis and poverty level among seniors over the age of 75 in the United States with a correlation coefficient (R) of 0.341 and weighted average of 11.8%. Similarly, the statistical analysis conducted on geographies consisting of 534,137,769 people shows a strong positive correlation between the proportion of Immigrants from Europe and poverty level among seniors over the age of 75 in the United States with a correlation coefficient (R) of 0.763 and weighted average of 12.2%, a difference of 3.5%.
Seniors Poverty Over the Age of 75 Correlation Summary
| Measurement | Pakistani | Immigrants from Europe |
| Minimum | 3.3% | 7.9% |
| Maximum | 60.0% | 100.0% |
| Range | 56.7% | 92.1% |
| Mean | 15.1% | 23.0% |
| Median | 11.6% | 12.7% |
| Interquartile 25% (IQ1) | 9.4% | 11.1% |
| Interquartile 75% (IQ3) | 15.6% | 20.0% |
| Interquartile Range (IQR) | 6.1% | 8.9% |
| Standard Deviation (Sample) | 11.0% | 24.6% |
| Standard Deviation (Population) | 11.0% | 24.4% |
Similar Demographics by Seniors Poverty Over the Age of 75
Demographics Similar to Pakistanis by Seniors Poverty Over the Age of 75
In terms of seniors poverty over the age of 75, the demographic groups most similar to Pakistanis are Immigrants from Italy (11.8%, a difference of 0.0%), Malaysian (11.8%, a difference of 0.010%), Fijian (11.8%, a difference of 0.030%), Sudanese (11.8%, a difference of 0.060%), and Immigrants from Nepal (11.8%, a difference of 0.080%).
| Demographics | Rating | Rank | Seniors Poverty Over the Age of 75 |
| New Zealanders | 86.3 /100 | #115 | Excellent 11.7% |
| Iraqis | 86.3 /100 | #116 | Excellent 11.7% |
| Icelanders | 85.7 /100 | #117 | Excellent 11.7% |
| Immigrants | Zimbabwe | 85.5 /100 | #118 | Excellent 11.7% |
| Immigrants | Uganda | 84.8 /100 | #119 | Excellent 11.8% |
| Immigrants | Nepal | 84.5 /100 | #120 | Excellent 11.8% |
| Malaysians | 84.1 /100 | #121 | Excellent 11.8% |
| Pakistanis | 84.0 /100 | #122 | Excellent 11.8% |
| Immigrants | Italy | 84.0 /100 | #123 | Excellent 11.8% |
| Fijians | 83.8 /100 | #124 | Excellent 11.8% |
| Sudanese | 83.6 /100 | #125 | Excellent 11.8% |
| Pennsylvania Germans | 83.4 /100 | #126 | Excellent 11.8% |
| Immigrants | Denmark | 82.6 /100 | #127 | Excellent 11.8% |
| Immigrants | Hungary | 81.7 /100 | #128 | Excellent 11.8% |
| Ethiopians | 80.7 /100 | #129 | Excellent 11.8% |
Demographics Similar to Immigrants from Europe by Seniors Poverty Over the Age of 75
In terms of seniors poverty over the age of 75, the demographic groups most similar to Immigrants from Europe are Arab (12.2%, a difference of 0.040%), Immigrants from Saudi Arabia (12.2%, a difference of 0.040%), Immigrants from Fiji (12.2%, a difference of 0.12%), Spaniard (12.2%, a difference of 0.13%), and Immigrants from Thailand (12.2%, a difference of 0.16%).
| Demographics | Rating | Rank | Seniors Poverty Over the Age of 75 |
| Immigrants | Switzerland | 54.5 /100 | #167 | Average 12.1% |
| Immigrants | Syria | 53.9 /100 | #168 | Average 12.2% |
| Immigrants | Egypt | 53.7 /100 | #169 | Average 12.2% |
| Immigrants | Thailand | 52.0 /100 | #170 | Average 12.2% |
| Spaniards | 51.6 /100 | #171 | Average 12.2% |
| Immigrants | Fiji | 51.5 /100 | #172 | Average 12.2% |
| Arabs | 50.5 /100 | #173 | Average 12.2% |
| Immigrants | Europe | 50.0 /100 | #174 | Average 12.2% |
| Immigrants | Saudi Arabia | 49.5 /100 | #175 | Average 12.2% |
| Immigrants | Iran | 48.1 /100 | #176 | Average 12.2% |
| Immigrants | Asia | 47.8 /100 | #177 | Average 12.2% |
| Immigrants | Nonimmigrants | 46.8 /100 | #178 | Average 12.2% |
| Mongolians | 45.5 /100 | #179 | Average 12.2% |
| Immigrants | South Eastern Asia | 44.3 /100 | #180 | Average 12.2% |
| Immigrants | Australia | 44.2 /100 | #181 | Average 12.2% |