Nonimmigrants vs Immigrants from Uganda Seniors Poverty Over the Age of 65
COMPARE
Nonimmigrants
Immigrants from Uganda
Seniors Poverty Over the Age of 65
Seniors Poverty Over the Age of 65 Comparison
Nonimmigrants
Immigrants from Uganda
10.9%
SENIORS POVERTY OVER THE AGE OF 65
55.1/ 100
METRIC RATING
171st/ 347
METRIC RANK
11.1%
SENIORS POVERTY OVER THE AGE OF 65
32.2/ 100
METRIC RATING
191st/ 347
METRIC RANK
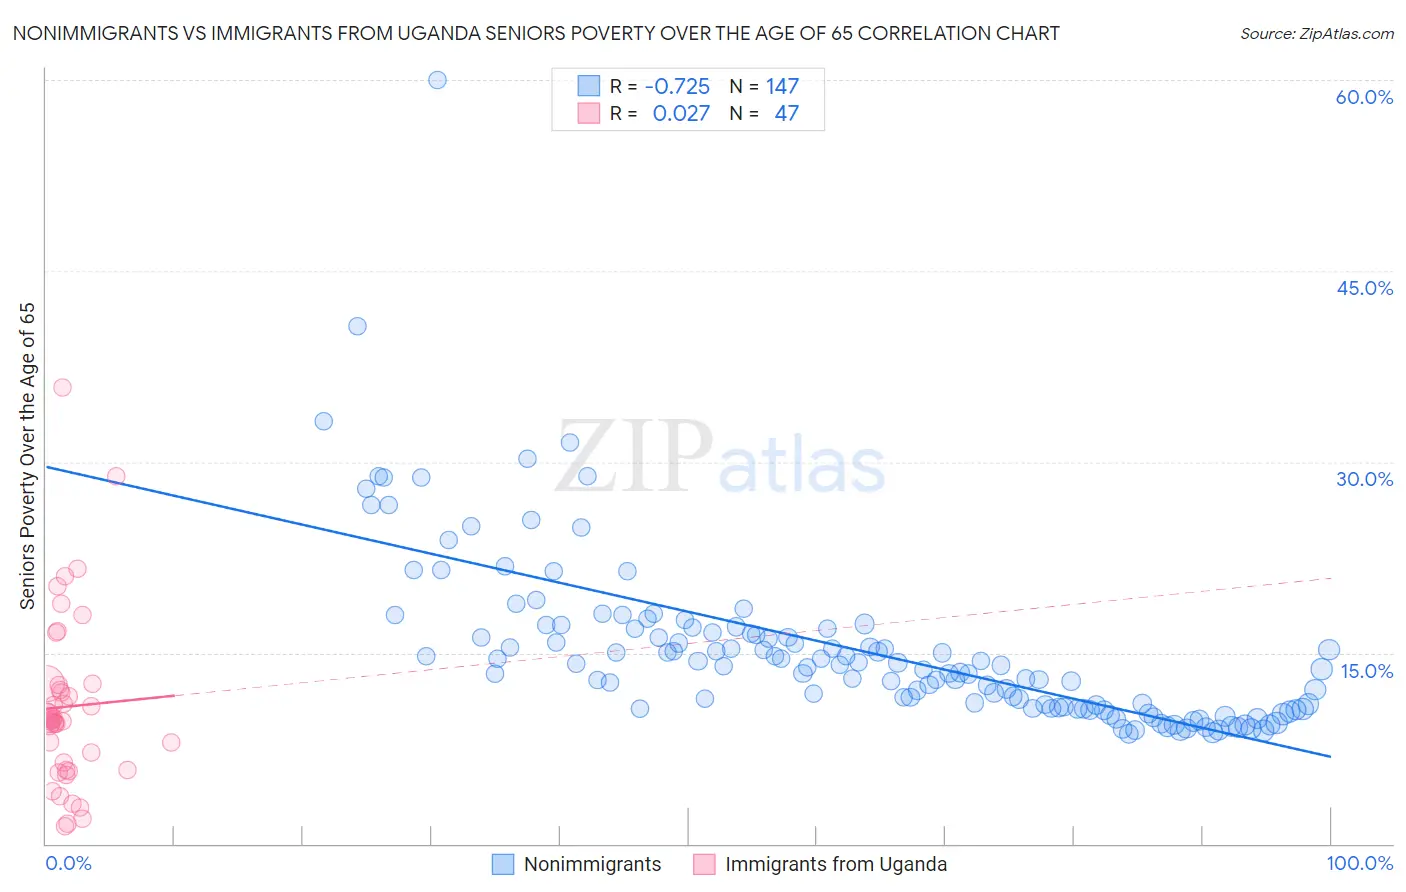
Nonimmigrants vs Immigrants from Uganda Seniors Poverty Over the Age of 65 Correlation Chart
The statistical analysis conducted on geographies consisting of 577,791,291 people shows a strong negative correlation between the proportion of Nonimmigrants and poverty level among seniors over the age of 65 in the United States with a correlation coefficient (R) of -0.725 and weighted average of 10.9%. Similarly, the statistical analysis conducted on geographies consisting of 125,911,000 people shows no correlation between the proportion of Immigrants from Uganda and poverty level among seniors over the age of 65 in the United States with a correlation coefficient (R) of 0.027 and weighted average of 11.1%, a difference of 2.1%.
Seniors Poverty Over the Age of 65 Correlation Summary
| Measurement | Nonimmigrants | Immigrants from Uganda |
| Minimum | 8.7% | 1.4% |
| Maximum | 60.0% | 35.9% |
| Range | 51.3% | 34.5% |
| Mean | 15.3% | 10.8% |
| Median | 14.0% | 9.7% |
| Interquartile 25% (IQ1) | 10.6% | 5.8% |
| Interquartile 75% (IQ3) | 16.9% | 12.5% |
| Interquartile Range (IQR) | 6.2% | 6.7% |
| Standard Deviation (Sample) | 6.8% | 6.8% |
| Standard Deviation (Population) | 6.8% | 6.7% |
Demographics Similar to Nonimmigrants and Immigrants from Uganda by Seniors Poverty Over the Age of 65
In terms of seniors poverty over the age of 65, the demographic groups most similar to Nonimmigrants are Immigrants from Syria (10.9%, a difference of 0.040%), Spaniard (10.9%, a difference of 0.39%), Immigrants from Sudan (10.9%, a difference of 0.46%), Creek (10.9%, a difference of 0.49%), and Immigrants from Malaysia (11.0%, a difference of 0.65%). Similarly, the demographic groups most similar to Immigrants from Uganda are Indian (Asian) (11.1%, a difference of 0.20%), Immigrants from Laos (11.1%, a difference of 0.34%), Immigrants from Hong Kong (11.1%, a difference of 0.40%), Immigrants from Eastern Asia (11.1%, a difference of 0.51%), and Immigrants from Middle Africa (11.1%, a difference of 0.51%).
| Demographics | Rating | Rank | Seniors Poverty Over the Age of 65 |
| Immigrants | Nonimmigrants | 55.1 /100 | #171 | Average 10.9% |
| Immigrants | Syria | 54.7 /100 | #172 | Average 10.9% |
| Spaniards | 50.7 /100 | #173 | Average 10.9% |
| Immigrants | Sudan | 50.0 /100 | #174 | Average 10.9% |
| Creek | 49.6 /100 | #175 | Average 10.9% |
| Immigrants | Malaysia | 47.9 /100 | #176 | Average 11.0% |
| Cherokee | 47.3 /100 | #177 | Average 11.0% |
| German Russians | 46.9 /100 | #178 | Average 11.0% |
| Immigrants | Northern Africa | 44.6 /100 | #179 | Average 11.0% |
| Immigrants | Thailand | 43.5 /100 | #180 | Average 11.0% |
| Immigrants | Eastern Africa | 43.4 /100 | #181 | Average 11.0% |
| Immigrants | Fiji | 42.0 /100 | #182 | Average 11.0% |
| Immigrants | Kazakhstan | 41.0 /100 | #183 | Average 11.0% |
| Immigrants | France | 40.9 /100 | #184 | Average 11.0% |
| Immigrants | Lebanon | 38.2 /100 | #185 | Fair 11.1% |
| Immigrants | Eastern Asia | 37.5 /100 | #186 | Fair 11.1% |
| Immigrants | Middle Africa | 37.4 /100 | #187 | Fair 11.1% |
| Immigrants | Hong Kong | 36.3 /100 | #188 | Fair 11.1% |
| Immigrants | Laos | 35.7 /100 | #189 | Fair 11.1% |
| Indians (Asian) | 34.2 /100 | #190 | Fair 11.1% |
| Immigrants | Uganda | 32.2 /100 | #191 | Fair 11.1% |