Nigerian vs Arapaho Seniors Poverty Over the Age of 75
COMPARE
Nigerian
Arapaho
Seniors Poverty Over the Age of 75
Seniors Poverty Over the Age of 75 Comparison
Nigerians
Arapaho
13.0%
SENIORS POVERTY OVER THE AGE OF 75
3.4/ 100
METRIC RATING
222nd/ 347
METRIC RANK
12.7%
SENIORS POVERTY OVER THE AGE OF 75
10.9/ 100
METRIC RATING
202nd/ 347
METRIC RANK
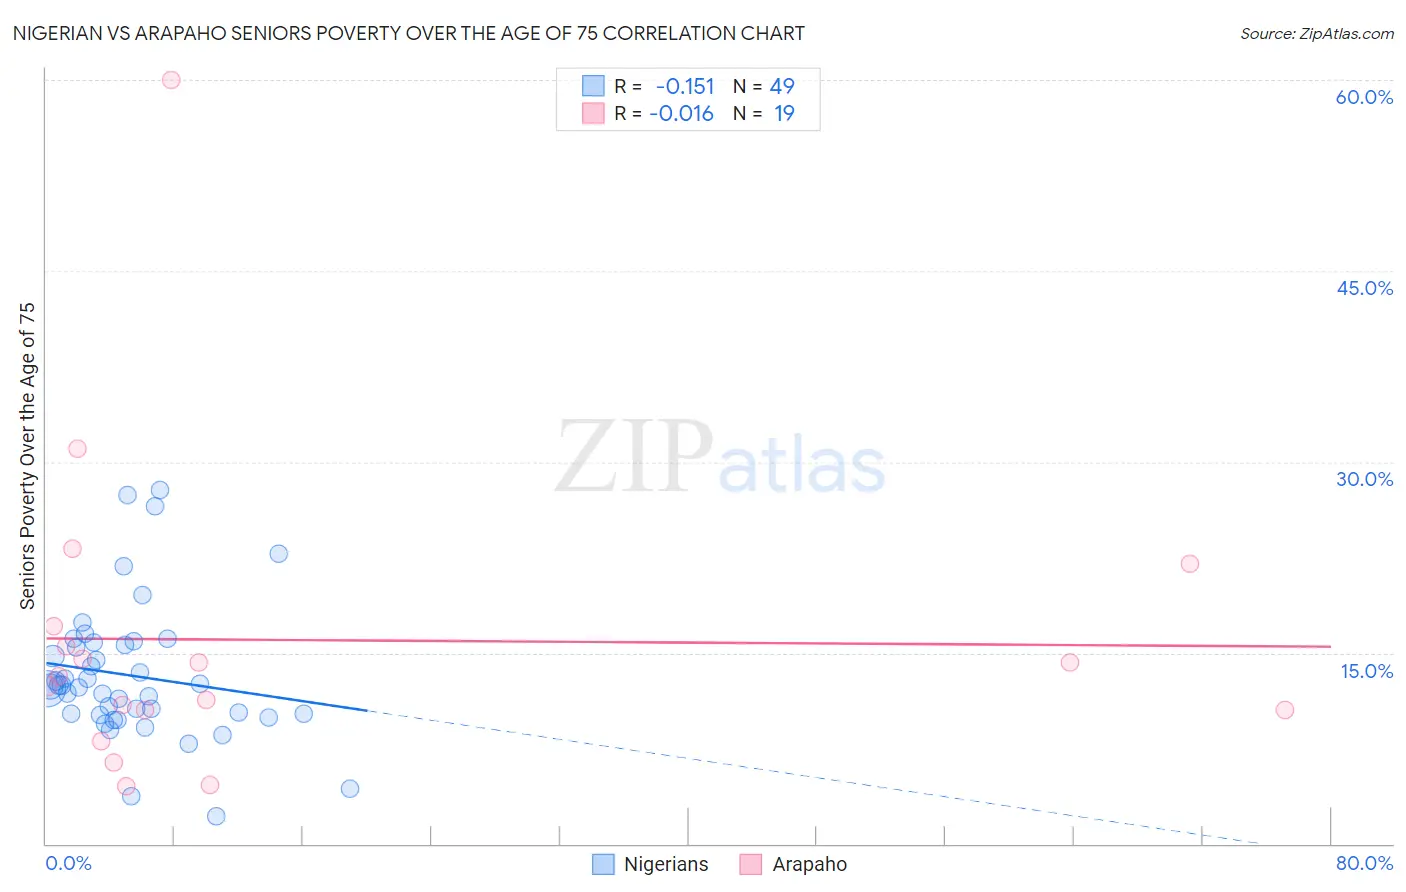
Nigerian vs Arapaho Seniors Poverty Over the Age of 75 Correlation Chart
The statistical analysis conducted on geographies consisting of 329,712,817 people shows a poor negative correlation between the proportion of Nigerians and poverty level among seniors over the age of 75 in the United States with a correlation coefficient (R) of -0.151 and weighted average of 13.0%. Similarly, the statistical analysis conducted on geographies consisting of 29,654,575 people shows no correlation between the proportion of Arapaho and poverty level among seniors over the age of 75 in the United States with a correlation coefficient (R) of -0.016 and weighted average of 12.7%, a difference of 2.4%.
Seniors Poverty Over the Age of 75 Correlation Summary
| Measurement | Nigerian | Arapaho |
| Minimum | 2.2% | 4.5% |
| Maximum | 27.8% | 60.0% |
| Range | 25.6% | 55.5% |
| Mean | 13.2% | 16.0% |
| Median | 12.3% | 13.2% |
| Interquartile 25% (IQ1) | 10.2% | 10.5% |
| Interquartile 75% (IQ3) | 15.7% | 17.1% |
| Interquartile Range (IQR) | 5.5% | 6.6% |
| Standard Deviation (Sample) | 5.3% | 12.5% |
| Standard Deviation (Population) | 5.3% | 12.2% |
Demographics Similar to Nigerians and Arapaho by Seniors Poverty Over the Age of 75
In terms of seniors poverty over the age of 75, the demographic groups most similar to Nigerians are Immigrants from Kazakhstan (13.0%, a difference of 0.44%), Seminole (12.9%, a difference of 0.53%), Ute (12.9%, a difference of 0.64%), Immigrants from Western Asia (12.9%, a difference of 0.70%), and Bermudan (12.9%, a difference of 0.73%). Similarly, the demographic groups most similar to Arapaho are Immigrants from Southern Europe (12.7%, a difference of 0.060%), Immigrants from Eritrea (12.7%, a difference of 0.090%), Indian (Asian) (12.7%, a difference of 0.25%), Albanian (12.7%, a difference of 0.29%), and Costa Rican (12.8%, a difference of 0.49%).
| Demographics | Rating | Rank | Seniors Poverty Over the Age of 75 |
| Arapaho | 10.9 /100 | #202 | Poor 12.7% |
| Immigrants | Southern Europe | 10.7 /100 | #203 | Poor 12.7% |
| Immigrants | Eritrea | 10.5 /100 | #204 | Poor 12.7% |
| Indians (Asian) | 9.7 /100 | #205 | Tragic 12.7% |
| Albanians | 9.6 /100 | #206 | Tragic 12.7% |
| Costa Ricans | 8.7 /100 | #207 | Tragic 12.8% |
| Immigrants | Eastern Asia | 8.4 /100 | #208 | Tragic 12.8% |
| Immigrants | Liberia | 7.3 /100 | #209 | Tragic 12.8% |
| Comanche | 7.0 /100 | #210 | Tragic 12.8% |
| Brazilians | 6.9 /100 | #211 | Tragic 12.8% |
| Immigrants | Hong Kong | 6.5 /100 | #212 | Tragic 12.8% |
| French American Indians | 6.1 /100 | #213 | Tragic 12.9% |
| Immigrants | Africa | 5.9 /100 | #214 | Tragic 12.9% |
| South American Indians | 5.5 /100 | #215 | Tragic 12.9% |
| Immigrants | Brazil | 5.2 /100 | #216 | Tragic 12.9% |
| Bermudans | 4.9 /100 | #217 | Tragic 12.9% |
| Immigrants | Western Asia | 4.9 /100 | #218 | Tragic 12.9% |
| Ute | 4.7 /100 | #219 | Tragic 12.9% |
| Seminole | 4.5 /100 | #220 | Tragic 12.9% |
| Immigrants | Kazakhstan | 4.3 /100 | #221 | Tragic 13.0% |
| Nigerians | 3.4 /100 | #222 | Tragic 13.0% |