Menominee vs Jordanian Child Poverty Among Boys Under 16
COMPARE
Menominee
Jordanian
Child Poverty Among Boys Under 16
Child Poverty Among Boys Under 16 Comparison
Menominee
Jordanians
21.7%
CHILD POVERTY AMONG BOYS UNDER 16
0.0/ 100
METRIC RATING
316th/ 347
METRIC RANK
15.1%
CHILD POVERTY AMONG BOYS UNDER 16
95.1/ 100
METRIC RATING
107th/ 347
METRIC RANK
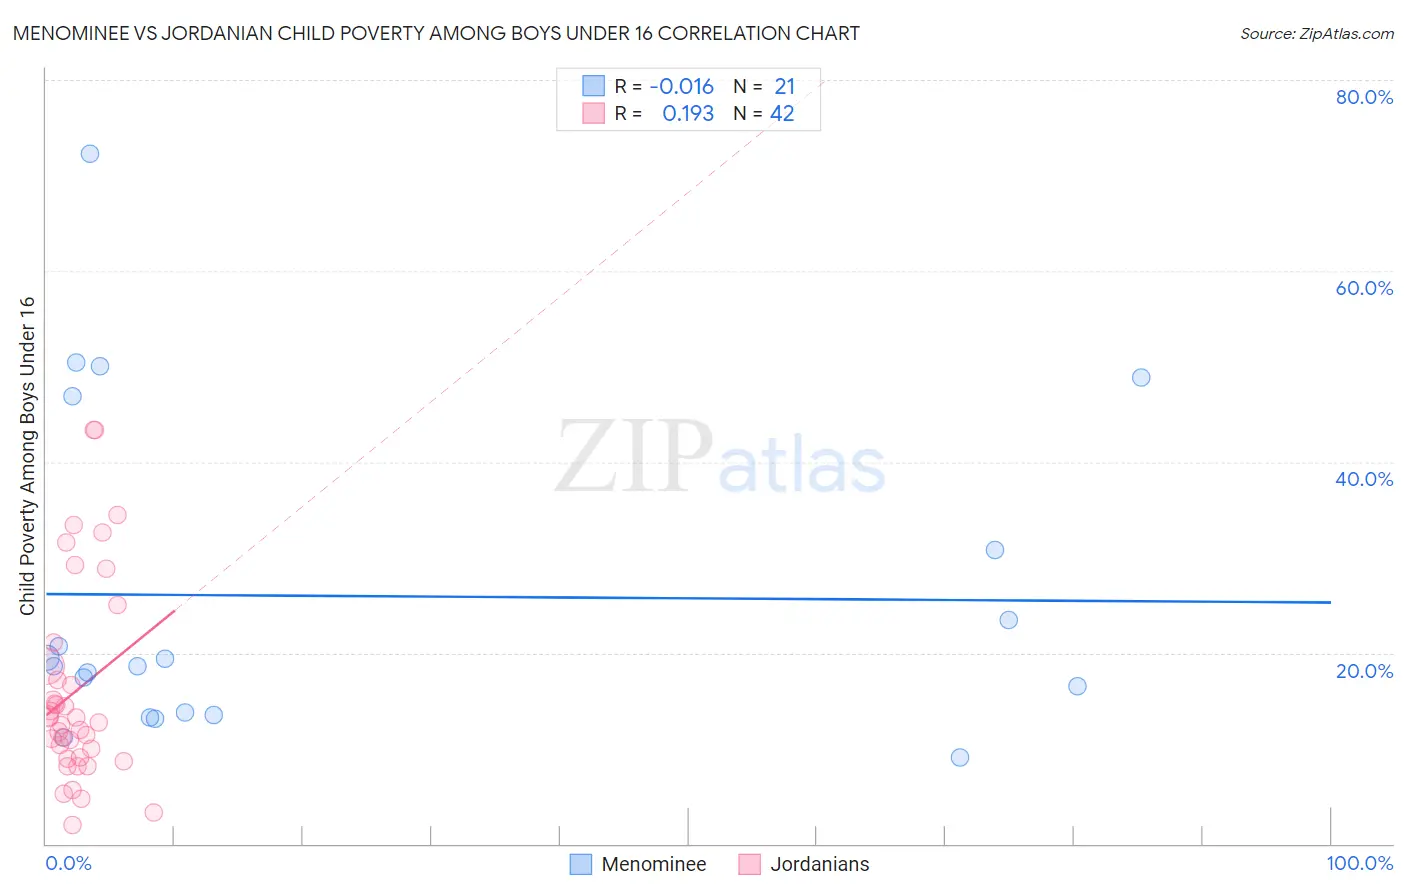
Menominee vs Jordanian Child Poverty Among Boys Under 16 Correlation Chart
The statistical analysis conducted on geographies consisting of 45,657,093 people shows no correlation between the proportion of Menominee and poverty level among boys under the age of 16 in the United States with a correlation coefficient (R) of -0.016 and weighted average of 21.7%. Similarly, the statistical analysis conducted on geographies consisting of 165,479,889 people shows a poor positive correlation between the proportion of Jordanians and poverty level among boys under the age of 16 in the United States with a correlation coefficient (R) of 0.193 and weighted average of 15.1%, a difference of 44.0%.
Child Poverty Among Boys Under 16 Correlation Summary
| Measurement | Menominee | Jordanian |
| Minimum | 9.1% | 1.9% |
| Maximum | 72.3% | 43.3% |
| Range | 63.2% | 41.4% |
| Mean | 26.0% | 16.0% |
| Median | 18.6% | 13.0% |
| Interquartile 25% (IQ1) | 13.7% | 9.0% |
| Interquartile 75% (IQ3) | 38.8% | 18.5% |
| Interquartile Range (IQR) | 25.1% | 9.5% |
| Standard Deviation (Sample) | 17.2% | 10.4% |
| Standard Deviation (Population) | 16.7% | 10.3% |
Similar Demographics by Child Poverty Among Boys Under 16
Demographics Similar to Menominee by Child Poverty Among Boys Under 16
In terms of child poverty among boys under 16, the demographic groups most similar to Menominee are Immigrants from Somalia (21.7%, a difference of 0.0%), African (21.7%, a difference of 0.080%), Yakama (21.7%, a difference of 0.14%), Ute (21.6%, a difference of 0.60%), and Immigrants from Guatemala (21.6%, a difference of 0.62%).
| Demographics | Rating | Rank | Child Poverty Among Boys Under 16 |
| Seminole | 0.0 /100 | #309 | Tragic 21.5% |
| Creek | 0.0 /100 | #310 | Tragic 21.5% |
| Bahamians | 0.0 /100 | #311 | Tragic 21.6% |
| Immigrants | Guatemala | 0.0 /100 | #312 | Tragic 21.6% |
| British West Indians | 0.0 /100 | #313 | Tragic 21.6% |
| Ute | 0.0 /100 | #314 | Tragic 21.6% |
| Immigrants | Somalia | 0.0 /100 | #315 | Tragic 21.7% |
| Menominee | 0.0 /100 | #316 | Tragic 21.7% |
| Africans | 0.0 /100 | #317 | Tragic 21.7% |
| Yakama | 0.0 /100 | #318 | Tragic 21.7% |
| Dutch West Indians | 0.0 /100 | #319 | Tragic 21.8% |
| U.S. Virgin Islanders | 0.0 /100 | #320 | Tragic 22.0% |
| Cajuns | 0.0 /100 | #321 | Tragic 22.2% |
| Immigrants | Dominica | 0.0 /100 | #322 | Tragic 22.2% |
| Hondurans | 0.0 /100 | #323 | Tragic 22.3% |
Demographics Similar to Jordanians by Child Poverty Among Boys Under 16
In terms of child poverty among boys under 16, the demographic groups most similar to Jordanians are Serbian (15.1%, a difference of 0.11%), Immigrants from England (15.1%, a difference of 0.17%), Pakistani (15.1%, a difference of 0.21%), Dutch (15.0%, a difference of 0.22%), and Immigrants from Switzerland (15.0%, a difference of 0.24%).
| Demographics | Rating | Rank | Child Poverty Among Boys Under 16 |
| Chileans | 95.8 /100 | #100 | Exceptional 15.0% |
| Immigrants | Belarus | 95.7 /100 | #101 | Exceptional 15.0% |
| Romanians | 95.6 /100 | #102 | Exceptional 15.0% |
| Immigrants | Denmark | 95.6 /100 | #103 | Exceptional 15.0% |
| Immigrants | Switzerland | 95.4 /100 | #104 | Exceptional 15.0% |
| Dutch | 95.4 /100 | #105 | Exceptional 15.0% |
| Serbians | 95.2 /100 | #106 | Exceptional 15.1% |
| Jordanians | 95.1 /100 | #107 | Exceptional 15.1% |
| Immigrants | England | 94.8 /100 | #108 | Exceptional 15.1% |
| Pakistanis | 94.7 /100 | #109 | Exceptional 15.1% |
| English | 94.3 /100 | #110 | Exceptional 15.1% |
| Immigrants | Zimbabwe | 94.2 /100 | #111 | Exceptional 15.2% |
| Basques | 93.8 /100 | #112 | Exceptional 15.2% |
| Irish | 93.8 /100 | #113 | Exceptional 15.2% |
| Immigrants | Ukraine | 93.6 /100 | #114 | Exceptional 15.2% |