Malaysian vs Lebanese Female Poverty Among 18-24 Year Olds
COMPARE
Malaysian
Lebanese
Female Poverty Among 18-24 Year Olds
Female Poverty Among 18-24 Year Olds Comparison
Malaysians
Lebanese
19.9%
FEMALE POVERTY AMONG 18-24 YEAR OLDS
72.7/ 100
METRIC RATING
163rd/ 347
METRIC RANK
20.2%
FEMALE POVERTY AMONG 18-24 YEAR OLDS
40.6/ 100
METRIC RATING
183rd/ 347
METRIC RANK
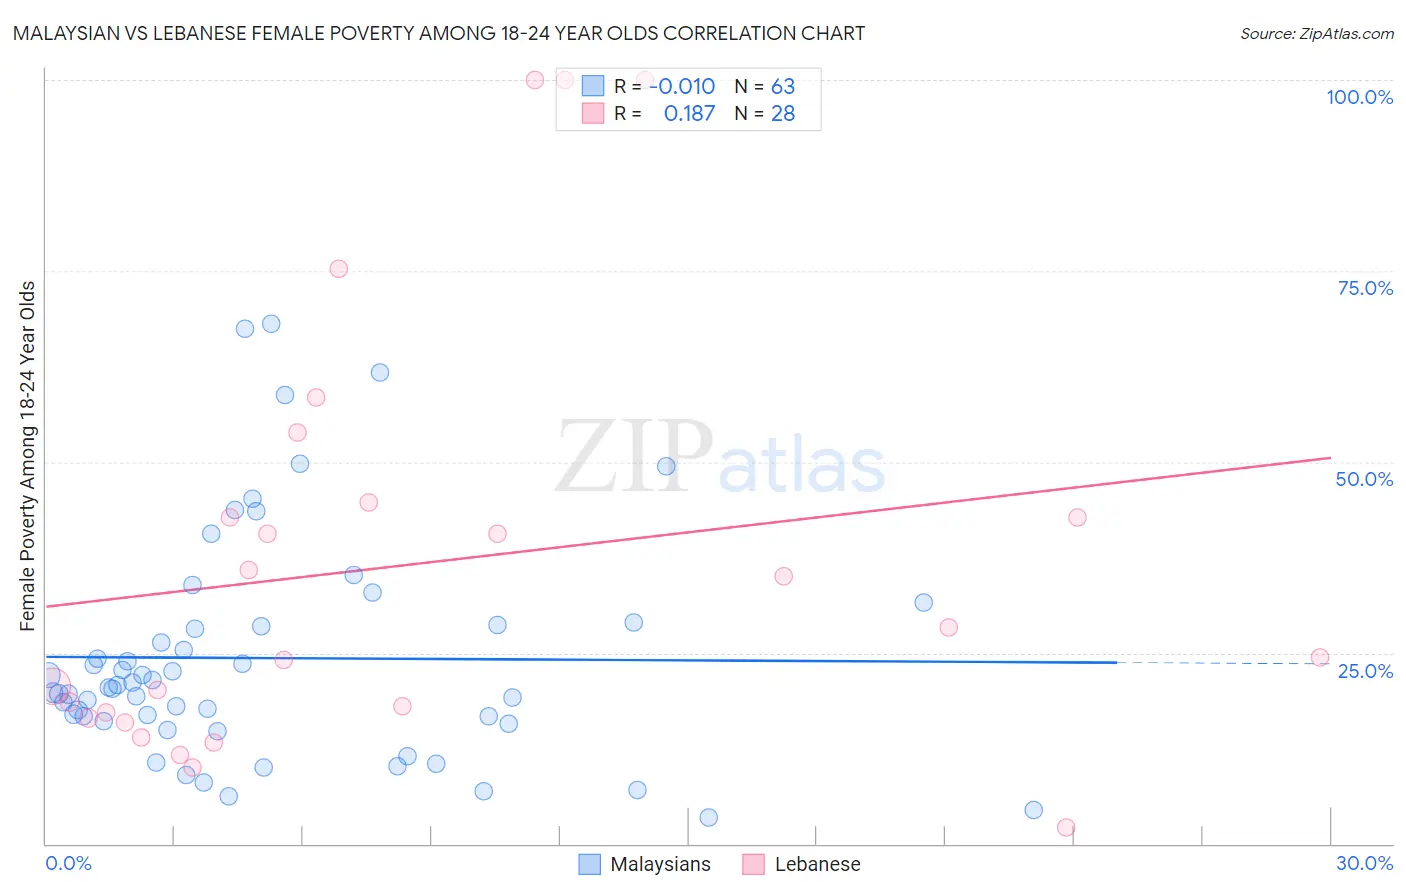
Malaysian vs Lebanese Female Poverty Among 18-24 Year Olds Correlation Chart
The statistical analysis conducted on geographies consisting of 223,979,694 people shows no correlation between the proportion of Malaysians and poverty level among females between the ages 18 and 24 in the United States with a correlation coefficient (R) of -0.010 and weighted average of 19.9%. Similarly, the statistical analysis conducted on geographies consisting of 389,866,359 people shows a poor positive correlation between the proportion of Lebanese and poverty level among females between the ages 18 and 24 in the United States with a correlation coefficient (R) of 0.187 and weighted average of 20.2%, a difference of 1.7%.
Female Poverty Among 18-24 Year Olds Correlation Summary
| Measurement | Malaysian | Lebanese |
| Minimum | 3.5% | 2.1% |
| Maximum | 68.1% | 100.0% |
| Range | 64.6% | 97.9% |
| Mean | 24.3% | 36.6% |
| Median | 20.5% | 26.3% |
| Interquartile 25% (IQ1) | 16.1% | 16.9% |
| Interquartile 75% (IQ3) | 28.6% | 43.7% |
| Interquartile Range (IQR) | 12.5% | 26.9% |
| Standard Deviation (Sample) | 14.8% | 27.8% |
| Standard Deviation (Population) | 14.7% | 27.3% |
Demographics Similar to Malaysians and Lebanese by Female Poverty Among 18-24 Year Olds
In terms of female poverty among 18-24 year olds, the demographic groups most similar to Malaysians are Central American (19.9%, a difference of 0.16%), Eastern European (19.9%, a difference of 0.21%), Belgian (19.9%, a difference of 0.21%), Czechoslovakian (20.0%, a difference of 0.62%), and Fijian (20.0%, a difference of 0.75%). Similarly, the demographic groups most similar to Lebanese are Immigrants from Barbados (20.2%, a difference of 0.11%), Immigrants from China (20.2%, a difference of 0.12%), Iraqi (20.2%, a difference of 0.14%), Ethiopian (20.2%, a difference of 0.16%), and Swiss (20.2%, a difference of 0.17%).
| Demographics | Rating | Rank | Female Poverty Among 18-24 Year Olds |
| Malaysians | 72.7 /100 | #163 | Good 19.9% |
| Central Americans | 70.0 /100 | #164 | Good 19.9% |
| Eastern Europeans | 69.3 /100 | #165 | Good 19.9% |
| Belgians | 69.1 /100 | #166 | Good 19.9% |
| Czechoslovakians | 61.8 /100 | #167 | Good 20.0% |
| Fijians | 59.1 /100 | #168 | Average 20.0% |
| Hmong | 55.4 /100 | #169 | Average 20.0% |
| Iranians | 54.7 /100 | #170 | Average 20.1% |
| Immigrants | Nigeria | 54.3 /100 | #171 | Average 20.1% |
| Belizeans | 52.0 /100 | #172 | Average 20.1% |
| Irish | 50.0 /100 | #173 | Average 20.1% |
| Swedes | 50.0 /100 | #174 | Average 20.1% |
| South American Indians | 48.4 /100 | #175 | Average 20.1% |
| Kenyans | 44.9 /100 | #176 | Average 20.2% |
| Immigrants | Kazakhstan | 44.2 /100 | #177 | Average 20.2% |
| Swiss | 44.0 /100 | #178 | Average 20.2% |
| Ethiopians | 43.8 /100 | #179 | Average 20.2% |
| Iraqis | 43.3 /100 | #180 | Average 20.2% |
| Immigrants | China | 43.0 /100 | #181 | Average 20.2% |
| Immigrants | Barbados | 42.8 /100 | #182 | Average 20.2% |
| Lebanese | 40.6 /100 | #183 | Average 20.2% |