Jordanian vs Immigrants from Colombia Seniors Poverty Over the Age of 75
COMPARE
Jordanian
Immigrants from Colombia
Seniors Poverty Over the Age of 75
Seniors Poverty Over the Age of 75 Comparison
Jordanians
Immigrants from Colombia
11.6%
SENIORS POVERTY OVER THE AGE OF 75
90.8/ 100
METRIC RATING
101st/ 347
METRIC RANK
14.6%
SENIORS POVERTY OVER THE AGE OF 75
0.0/ 100
METRIC RATING
278th/ 347
METRIC RANK
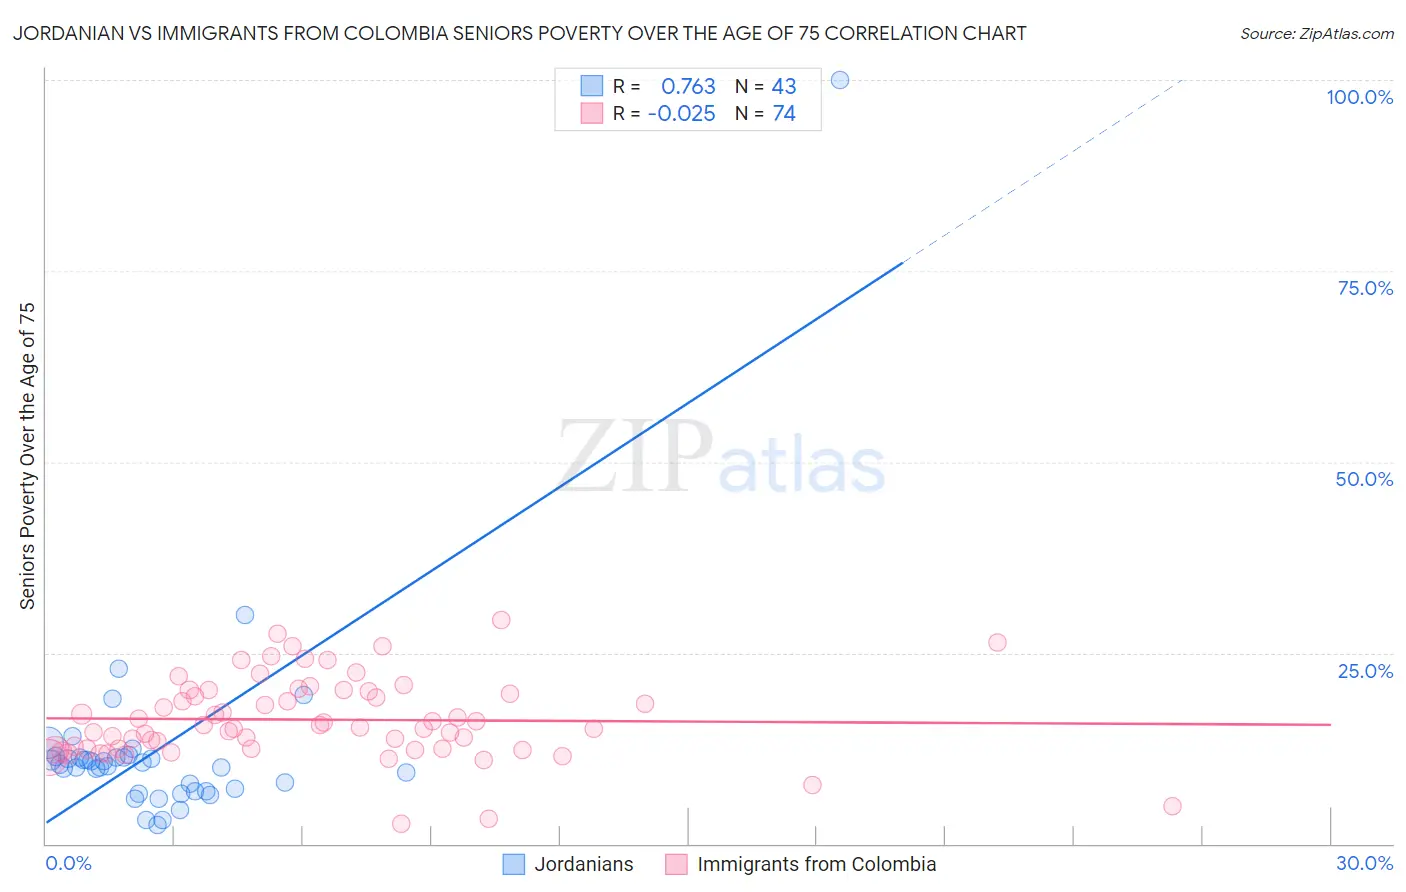
Jordanian vs Immigrants from Colombia Seniors Poverty Over the Age of 75 Correlation Chart
The statistical analysis conducted on geographies consisting of 165,896,130 people shows a strong positive correlation between the proportion of Jordanians and poverty level among seniors over the age of 75 in the United States with a correlation coefficient (R) of 0.763 and weighted average of 11.6%. Similarly, the statistical analysis conducted on geographies consisting of 374,797,276 people shows no correlation between the proportion of Immigrants from Colombia and poverty level among seniors over the age of 75 in the United States with a correlation coefficient (R) of -0.025 and weighted average of 14.6%, a difference of 25.8%.
Seniors Poverty Over the Age of 75 Correlation Summary
| Measurement | Jordanian | Immigrants from Colombia |
| Minimum | 2.4% | 2.6% |
| Maximum | 100.0% | 29.3% |
| Range | 97.6% | 26.6% |
| Mean | 12.5% | 16.2% |
| Median | 10.4% | 15.4% |
| Interquartile 25% (IQ1) | 6.9% | 12.4% |
| Interquartile 75% (IQ3) | 11.3% | 20.0% |
| Interquartile Range (IQR) | 4.4% | 7.6% |
| Standard Deviation (Sample) | 14.6% | 5.3% |
| Standard Deviation (Population) | 14.4% | 5.3% |
Similar Demographics by Seniors Poverty Over the Age of 75
Demographics Similar to Jordanians by Seniors Poverty Over the Age of 75
In terms of seniors poverty over the age of 75, the demographic groups most similar to Jordanians are Guamanian/Chamorro (11.6%, a difference of 0.040%), Syrian (11.6%, a difference of 0.080%), Immigrants from Kuwait (11.6%, a difference of 0.080%), Immigrants from Singapore (11.6%, a difference of 0.13%), and Chickasaw (11.6%, a difference of 0.14%).
| Demographics | Rating | Rank | Seniors Poverty Over the Age of 75 |
| Creek | 92.7 /100 | #94 | Exceptional 11.6% |
| Immigrants | Bosnia and Herzegovina | 92.6 /100 | #95 | Exceptional 11.6% |
| Immigrants | Sweden | 92.6 /100 | #96 | Exceptional 11.6% |
| Romanians | 92.3 /100 | #97 | Exceptional 11.6% |
| Immigrants | Japan | 91.9 /100 | #98 | Exceptional 11.6% |
| Immigrants | Ethiopia | 91.7 /100 | #99 | Exceptional 11.6% |
| Syrians | 91.1 /100 | #100 | Exceptional 11.6% |
| Jordanians | 90.8 /100 | #101 | Exceptional 11.6% |
| Guamanians/Chamorros | 90.6 /100 | #102 | Exceptional 11.6% |
| Immigrants | Kuwait | 90.5 /100 | #103 | Exceptional 11.6% |
| Immigrants | Singapore | 90.3 /100 | #104 | Exceptional 11.6% |
| Chickasaw | 90.2 /100 | #105 | Exceptional 11.6% |
| Russians | 89.9 /100 | #106 | Excellent 11.6% |
| Immigrants | Oceania | 89.4 /100 | #107 | Excellent 11.7% |
| Turks | 89.4 /100 | #108 | Excellent 11.7% |
Demographics Similar to Immigrants from Colombia by Seniors Poverty Over the Age of 75
In terms of seniors poverty over the age of 75, the demographic groups most similar to Immigrants from Colombia are Black/African American (14.6%, a difference of 0.21%), Senegalese (14.5%, a difference of 0.77%), Central American (14.7%, a difference of 0.85%), Belizean (14.8%, a difference of 0.97%), and Soviet Union (14.5%, a difference of 1.1%).
| Demographics | Rating | Rank | Seniors Poverty Over the Age of 75 |
| Immigrants | Ghana | 0.0 /100 | #271 | Tragic 14.4% |
| Mexicans | 0.0 /100 | #272 | Tragic 14.4% |
| Immigrants | South America | 0.0 /100 | #273 | Tragic 14.4% |
| Immigrants | Bahamas | 0.0 /100 | #274 | Tragic 14.4% |
| Immigrants | El Salvador | 0.0 /100 | #275 | Tragic 14.5% |
| Soviet Union | 0.0 /100 | #276 | Tragic 14.5% |
| Senegalese | 0.0 /100 | #277 | Tragic 14.5% |
| Immigrants | Colombia | 0.0 /100 | #278 | Tragic 14.6% |
| Blacks/African Americans | 0.0 /100 | #279 | Tragic 14.6% |
| Central Americans | 0.0 /100 | #280 | Tragic 14.7% |
| Belizeans | 0.0 /100 | #281 | Tragic 14.8% |
| Immigrants | Senegal | 0.0 /100 | #282 | Tragic 14.8% |
| Guatemalans | 0.0 /100 | #283 | Tragic 14.8% |
| Cheyenne | 0.0 /100 | #284 | Tragic 14.9% |
| Immigrants | Mexico | 0.0 /100 | #285 | Tragic 14.9% |