Japanese vs Immigrants from Egypt Receiving Food Stamps
COMPARE
Japanese
Immigrants from Egypt
Receiving Food Stamps
Receiving Food Stamps Comparison
Japanese
Immigrants from Egypt
14.1%
RECEIVING FOOD STAMPS
0.3/ 100
METRIC RATING
256th/ 347
METRIC RANK
10.3%
RECEIVING FOOD STAMPS
97.1/ 100
METRIC RATING
98th/ 347
METRIC RANK
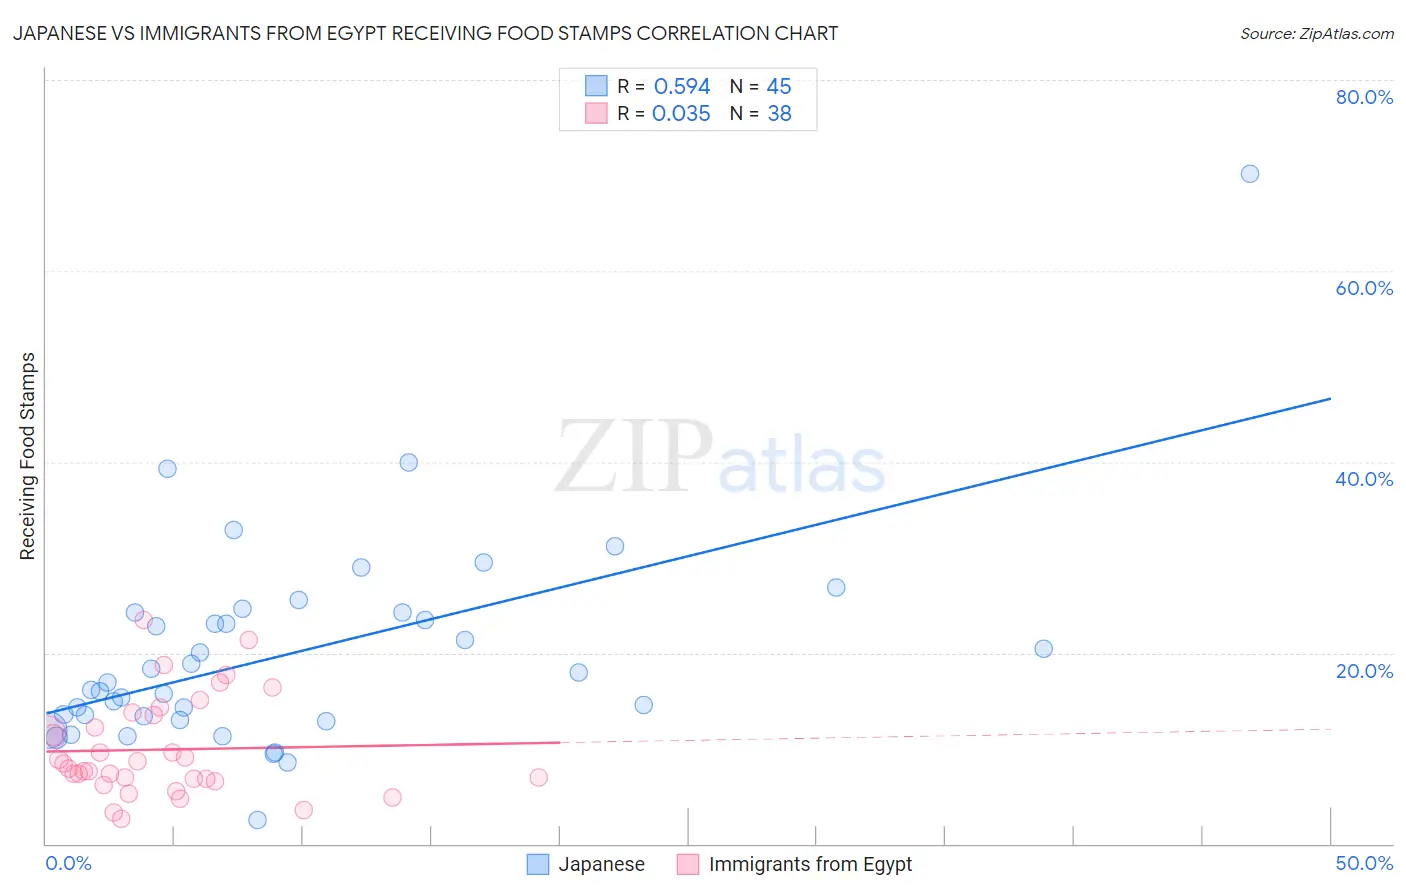
Japanese vs Immigrants from Egypt Receiving Food Stamps Correlation Chart
The statistical analysis conducted on geographies consisting of 248,870,971 people shows a substantial positive correlation between the proportion of Japanese and percentage of population receiving government assistance and/or food stamps in the United States with a correlation coefficient (R) of 0.594 and weighted average of 14.1%. Similarly, the statistical analysis conducted on geographies consisting of 245,027,906 people shows no correlation between the proportion of Immigrants from Egypt and percentage of population receiving government assistance and/or food stamps in the United States with a correlation coefficient (R) of 0.035 and weighted average of 10.3%, a difference of 36.9%.
Receiving Food Stamps Correlation Summary
| Measurement | Japanese | Immigrants from Egypt |
| Minimum | 2.5% | 2.6% |
| Maximum | 70.2% | 23.5% |
| Range | 67.7% | 20.9% |
| Mean | 19.9% | 9.9% |
| Median | 16.8% | 8.2% |
| Interquartile 25% (IQ1) | 13.1% | 6.8% |
| Interquartile 75% (IQ3) | 24.2% | 13.5% |
| Interquartile Range (IQR) | 11.1% | 6.7% |
| Standard Deviation (Sample) | 11.1% | 5.1% |
| Standard Deviation (Population) | 10.9% | 5.0% |
Similar Demographics by Receiving Food Stamps
Demographics Similar to Japanese by Receiving Food Stamps
In terms of receiving food stamps, the demographic groups most similar to Japanese are Subsaharan African (14.1%, a difference of 0.020%), Marshallese (14.1%, a difference of 0.030%), Arapaho (14.1%, a difference of 0.10%), Immigrants from Ghana (14.1%, a difference of 0.18%), and Creek (14.1%, a difference of 0.30%).
| Demographics | Rating | Rank | Receiving Food Stamps |
| Indonesians | 0.6 /100 | #249 | Tragic 13.9% |
| Immigrants | Cambodia | 0.5 /100 | #250 | Tragic 13.9% |
| Yaqui | 0.5 /100 | #251 | Tragic 13.9% |
| Ghanaians | 0.5 /100 | #252 | Tragic 14.0% |
| Spanish Americans | 0.4 /100 | #253 | Tragic 14.0% |
| Marshallese | 0.3 /100 | #254 | Tragic 14.1% |
| Sub-Saharan Africans | 0.3 /100 | #255 | Tragic 14.1% |
| Japanese | 0.3 /100 | #256 | Tragic 14.1% |
| Arapaho | 0.3 /100 | #257 | Tragic 14.1% |
| Immigrants | Ghana | 0.3 /100 | #258 | Tragic 14.1% |
| Creek | 0.3 /100 | #259 | Tragic 14.1% |
| Central Americans | 0.3 /100 | #260 | Tragic 14.1% |
| Immigrants | Congo | 0.3 /100 | #261 | Tragic 14.1% |
| Paiute | 0.2 /100 | #262 | Tragic 14.3% |
| Immigrants | Portugal | 0.2 /100 | #263 | Tragic 14.3% |
Demographics Similar to Immigrants from Egypt by Receiving Food Stamps
In terms of receiving food stamps, the demographic groups most similar to Immigrants from Egypt are Czechoslovakian (10.3%, a difference of 0.060%), Serbian (10.3%, a difference of 0.17%), Immigrants from Western Europe (10.3%, a difference of 0.30%), Palestinian (10.3%, a difference of 0.30%), and Welsh (10.3%, a difference of 0.31%).
| Demographics | Rating | Rank | Receiving Food Stamps |
| Jordanians | 97.9 /100 | #91 | Exceptional 10.2% |
| Irish | 97.9 /100 | #92 | Exceptional 10.2% |
| Belgians | 97.7 /100 | #93 | Exceptional 10.2% |
| Immigrants | Greece | 97.4 /100 | #94 | Exceptional 10.3% |
| Basques | 97.4 /100 | #95 | Exceptional 10.3% |
| Welsh | 97.3 /100 | #96 | Exceptional 10.3% |
| Czechoslovakians | 97.2 /100 | #97 | Exceptional 10.3% |
| Immigrants | Egypt | 97.1 /100 | #98 | Exceptional 10.3% |
| Serbians | 97.0 /100 | #99 | Exceptional 10.3% |
| Immigrants | Western Europe | 96.9 /100 | #100 | Exceptional 10.3% |
| Palestinians | 96.9 /100 | #101 | Exceptional 10.3% |
| Immigrants | Europe | 96.8 /100 | #102 | Exceptional 10.3% |
| Immigrants | Latvia | 96.8 /100 | #103 | Exceptional 10.3% |
| Immigrants | Hungary | 96.7 /100 | #104 | Exceptional 10.3% |
| Immigrants | Malaysia | 96.5 /100 | #105 | Exceptional 10.4% |