Irish vs Panamanian Seniors Poverty Over the Age of 65
COMPARE
Irish
Panamanian
Seniors Poverty Over the Age of 65
Seniors Poverty Over the Age of 65 Comparison
Irish
Panamanians
9.3%
SENIORS POVERTY OVER THE AGE OF 65
99.9/ 100
METRIC RATING
25th/ 347
METRIC RANK
11.9%
SENIORS POVERTY OVER THE AGE OF 65
1.8/ 100
METRIC RATING
233rd/ 347
METRIC RANK
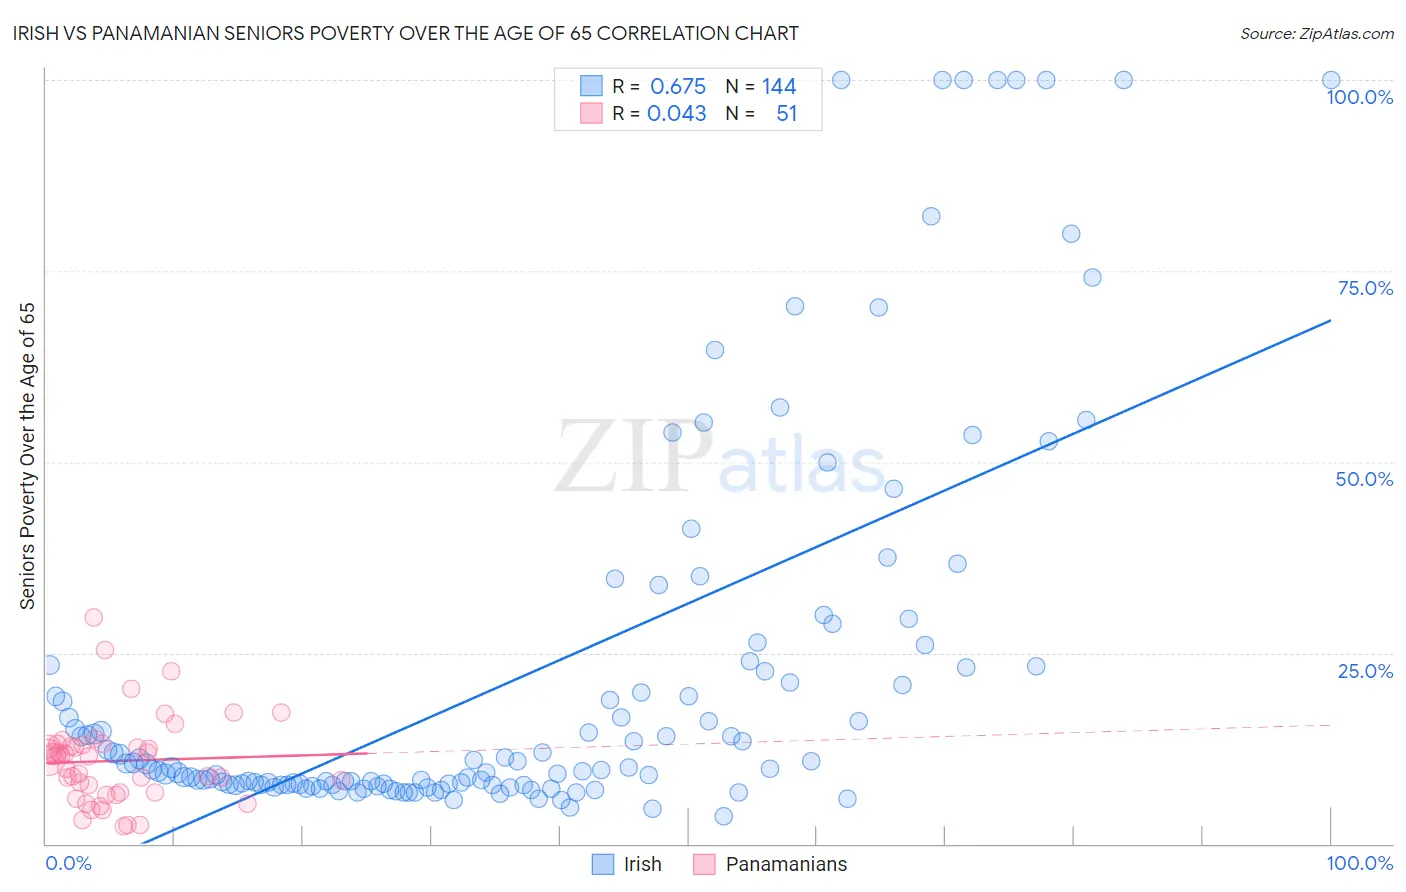
Irish vs Panamanian Seniors Poverty Over the Age of 65 Correlation Chart
The statistical analysis conducted on geographies consisting of 573,660,393 people shows a significant positive correlation between the proportion of Irish and poverty level among seniors over the age of 65 in the United States with a correlation coefficient (R) of 0.675 and weighted average of 9.3%. Similarly, the statistical analysis conducted on geographies consisting of 280,356,734 people shows no correlation between the proportion of Panamanians and poverty level among seniors over the age of 65 in the United States with a correlation coefficient (R) of 0.043 and weighted average of 11.9%, a difference of 28.2%.
Seniors Poverty Over the Age of 65 Correlation Summary
| Measurement | Irish | Panamanian |
| Minimum | 3.7% | 2.2% |
| Maximum | 100.0% | 29.6% |
| Range | 96.3% | 27.4% |
| Mean | 22.1% | 10.8% |
| Median | 10.0% | 11.5% |
| Interquartile 25% (IQ1) | 7.8% | 6.8% |
| Interquartile 75% (IQ3) | 23.2% | 13.0% |
| Interquartile Range (IQR) | 15.4% | 6.2% |
| Standard Deviation (Sample) | 25.3% | 5.6% |
| Standard Deviation (Population) | 25.2% | 5.6% |
Similar Demographics by Seniors Poverty Over the Age of 65
Demographics Similar to Irish by Seniors Poverty Over the Age of 65
In terms of seniors poverty over the age of 65, the demographic groups most similar to Irish are Immigrants from Scotland (9.3%, a difference of 0.030%), Italian (9.3%, a difference of 0.10%), Bulgarian (9.3%, a difference of 0.27%), Tongan (9.3%, a difference of 0.30%), and Welsh (9.3%, a difference of 0.35%).
| Demographics | Rating | Rank | Seniors Poverty Over the Age of 65 |
| Slovaks | 99.9 /100 | #18 | Exceptional 9.2% |
| Swiss | 99.9 /100 | #19 | Exceptional 9.2% |
| Thais | 99.9 /100 | #20 | Exceptional 9.2% |
| Luxembourgers | 99.9 /100 | #21 | Exceptional 9.2% |
| Slovenes | 99.9 /100 | #22 | Exceptional 9.3% |
| Welsh | 99.9 /100 | #23 | Exceptional 9.3% |
| Bulgarians | 99.9 /100 | #24 | Exceptional 9.3% |
| Irish | 99.9 /100 | #25 | Exceptional 9.3% |
| Immigrants | Scotland | 99.9 /100 | #26 | Exceptional 9.3% |
| Italians | 99.9 /100 | #27 | Exceptional 9.3% |
| Tongans | 99.9 /100 | #28 | Exceptional 9.3% |
| Bhutanese | 99.9 /100 | #29 | Exceptional 9.3% |
| Menominee | 99.8 /100 | #30 | Exceptional 9.4% |
| Finns | 99.8 /100 | #31 | Exceptional 9.4% |
| Northern Europeans | 99.8 /100 | #32 | Exceptional 9.4% |
Demographics Similar to Panamanians by Seniors Poverty Over the Age of 65
In terms of seniors poverty over the age of 65, the demographic groups most similar to Panamanians are Iroquois (11.9%, a difference of 0.090%), Yaqui (11.9%, a difference of 0.10%), Cajun (11.9%, a difference of 0.24%), Bermudan (11.9%, a difference of 0.29%), and Immigrants from Argentina (12.0%, a difference of 0.59%).
| Demographics | Rating | Rank | Seniors Poverty Over the Age of 65 |
| Liberians | 3.2 /100 | #226 | Tragic 11.8% |
| Nigerians | 3.2 /100 | #227 | Tragic 11.8% |
| Immigrants | Costa Rica | 2.7 /100 | #228 | Tragic 11.8% |
| Immigrants | Eritrea | 2.6 /100 | #229 | Tragic 11.8% |
| Bermudans | 2.1 /100 | #230 | Tragic 11.9% |
| Cajuns | 2.0 /100 | #231 | Tragic 11.9% |
| Yaqui | 1.9 /100 | #232 | Tragic 11.9% |
| Panamanians | 1.8 /100 | #233 | Tragic 11.9% |
| Iroquois | 1.7 /100 | #234 | Tragic 11.9% |
| Immigrants | Argentina | 1.3 /100 | #235 | Tragic 12.0% |
| Immigrants | Peru | 1.3 /100 | #236 | Tragic 12.0% |
| Moroccans | 1.2 /100 | #237 | Tragic 12.0% |
| Seminole | 1.1 /100 | #238 | Tragic 12.0% |
| Immigrants | Spain | 1.0 /100 | #239 | Tragic 12.1% |
| Comanche | 0.9 /100 | #240 | Tragic 12.1% |