Iranian vs Vietnamese Female Poverty Among 18-24 Year Olds
COMPARE
Iranian
Vietnamese
Female Poverty Among 18-24 Year Olds
Female Poverty Among 18-24 Year Olds Comparison
Iranians
Vietnamese
20.1%
FEMALE POVERTY AMONG 18-24 YEAR OLDS
54.7/ 100
METRIC RATING
170th/ 347
METRIC RANK
21.4%
FEMALE POVERTY AMONG 18-24 YEAR OLDS
0.6/ 100
METRIC RATING
258th/ 347
METRIC RANK
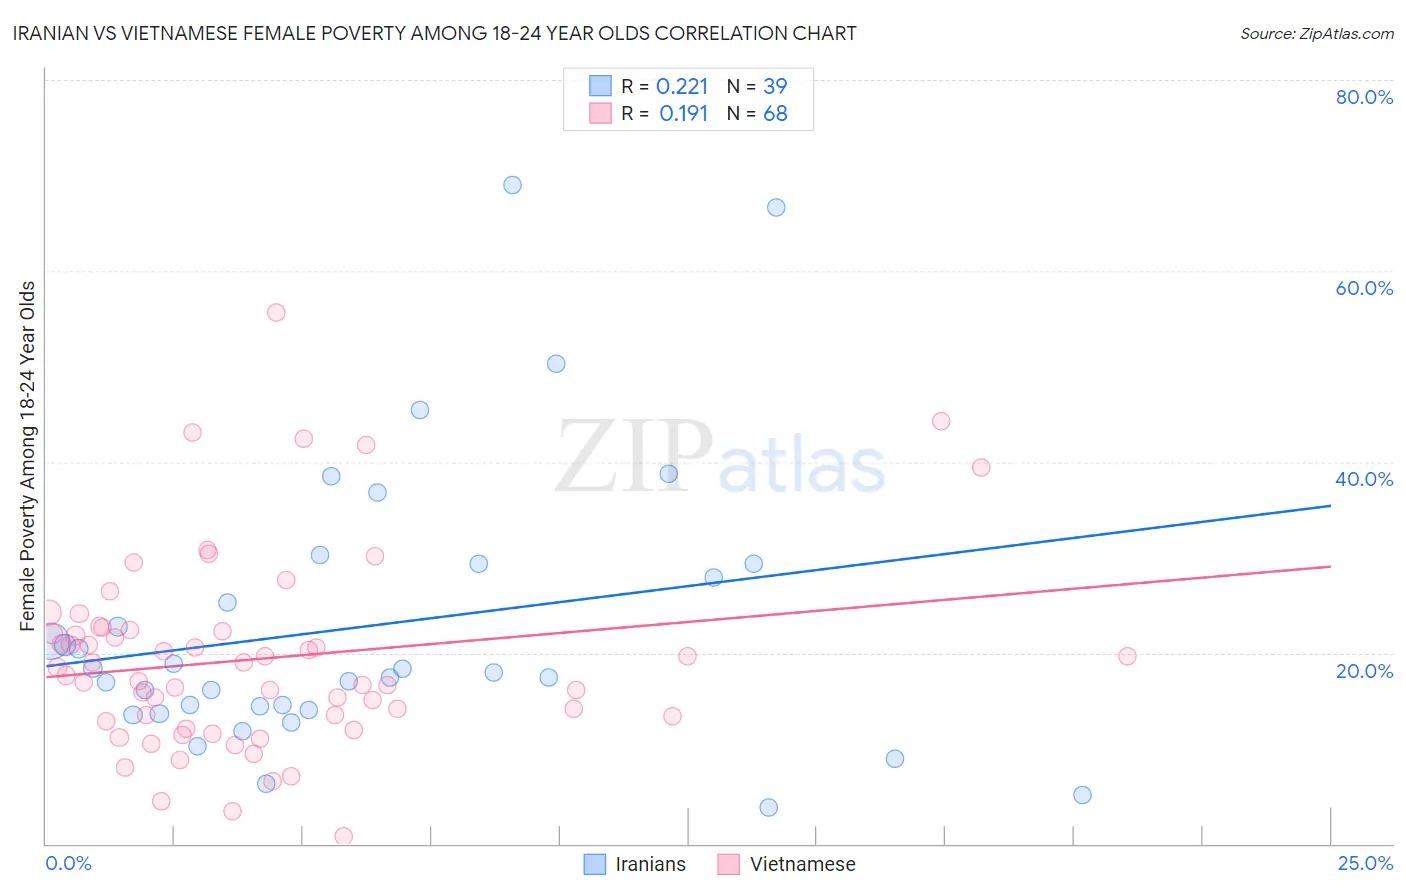
Iranian vs Vietnamese Female Poverty Among 18-24 Year Olds Correlation Chart
The statistical analysis conducted on geographies consisting of 310,982,905 people shows a weak positive correlation between the proportion of Iranians and poverty level among females between the ages 18 and 24 in the United States with a correlation coefficient (R) of 0.221 and weighted average of 20.1%. Similarly, the statistical analysis conducted on geographies consisting of 169,238,901 people shows a poor positive correlation between the proportion of Vietnamese and poverty level among females between the ages 18 and 24 in the United States with a correlation coefficient (R) of 0.191 and weighted average of 21.4%, a difference of 6.5%.
Female Poverty Among 18-24 Year Olds Correlation Summary
| Measurement | Iranian | Vietnamese |
| Minimum | 3.8% | 0.84% |
| Maximum | 69.0% | 55.6% |
| Range | 65.1% | 54.8% |
| Mean | 22.8% | 19.4% |
| Median | 18.0% | 18.0% |
| Interquartile 25% (IQ1) | 14.0% | 13.1% |
| Interquartile 75% (IQ3) | 29.3% | 22.3% |
| Interquartile Range (IQR) | 15.2% | 9.3% |
| Standard Deviation (Sample) | 14.9% | 10.2% |
| Standard Deviation (Population) | 14.7% | 10.1% |
Similar Demographics by Female Poverty Among 18-24 Year Olds
Demographics Similar to Iranians by Female Poverty Among 18-24 Year Olds
In terms of female poverty among 18-24 year olds, the demographic groups most similar to Iranians are Immigrants from Nigeria (20.1%, a difference of 0.020%), Hmong (20.0%, a difference of 0.040%), Belizean (20.1%, a difference of 0.13%), Fijian (20.0%, a difference of 0.22%), and Irish (20.1%, a difference of 0.23%).
| Demographics | Rating | Rank | Female Poverty Among 18-24 Year Olds |
| Malaysians | 72.7 /100 | #163 | Good 19.9% |
| Central Americans | 70.0 /100 | #164 | Good 19.9% |
| Eastern Europeans | 69.3 /100 | #165 | Good 19.9% |
| Belgians | 69.1 /100 | #166 | Good 19.9% |
| Czechoslovakians | 61.8 /100 | #167 | Good 20.0% |
| Fijians | 59.1 /100 | #168 | Average 20.0% |
| Hmong | 55.4 /100 | #169 | Average 20.0% |
| Iranians | 54.7 /100 | #170 | Average 20.1% |
| Immigrants | Nigeria | 54.3 /100 | #171 | Average 20.1% |
| Belizeans | 52.0 /100 | #172 | Average 20.1% |
| Irish | 50.0 /100 | #173 | Average 20.1% |
| Swedes | 50.0 /100 | #174 | Average 20.1% |
| South American Indians | 48.4 /100 | #175 | Average 20.1% |
| Kenyans | 44.9 /100 | #176 | Average 20.2% |
| Immigrants | Kazakhstan | 44.2 /100 | #177 | Average 20.2% |
Demographics Similar to Vietnamese by Female Poverty Among 18-24 Year Olds
In terms of female poverty among 18-24 year olds, the demographic groups most similar to Vietnamese are Immigrants from France (21.4%, a difference of 0.030%), Immigrants from Norway (21.4%, a difference of 0.080%), Immigrants from Bahamas (21.4%, a difference of 0.14%), Immigrants from Eastern Africa (21.4%, a difference of 0.34%), and Taiwanese (21.2%, a difference of 0.54%).
| Demographics | Rating | Rank | Female Poverty Among 18-24 Year Olds |
| West Indians | 1.9 /100 | #251 | Tragic 21.1% |
| South Africans | 1.6 /100 | #252 | Tragic 21.1% |
| Delaware | 1.6 /100 | #253 | Tragic 21.1% |
| British West Indians | 1.2 /100 | #254 | Tragic 21.2% |
| Immigrants | Grenada | 1.2 /100 | #255 | Tragic 21.2% |
| Tsimshian | 1.0 /100 | #256 | Tragic 21.2% |
| Taiwanese | 1.0 /100 | #257 | Tragic 21.2% |
| Vietnamese | 0.6 /100 | #258 | Tragic 21.4% |
| Immigrants | France | 0.6 /100 | #259 | Tragic 21.4% |
| Immigrants | Norway | 0.6 /100 | #260 | Tragic 21.4% |
| Immigrants | Bahamas | 0.5 /100 | #261 | Tragic 21.4% |
| Immigrants | Eastern Africa | 0.4 /100 | #262 | Tragic 21.4% |
| Icelanders | 0.3 /100 | #263 | Tragic 21.5% |
| Hondurans | 0.3 /100 | #264 | Tragic 21.5% |
| Immigrants | Nonimmigrants | 0.3 /100 | #265 | Tragic 21.5% |