Immigrants from Zaire vs Immigrants from Mexico Single Father Poverty
COMPARE
Immigrants from Zaire
Immigrants from Mexico
Single Father Poverty
Single Father Poverty Comparison
Immigrants from Zaire
Immigrants from Mexico
17.3%
SINGLE FATHER POVERTY
0.4/ 100
METRIC RATING
262nd/ 347
METRIC RANK
16.0%
SINGLE FATHER POVERTY
83.3/ 100
METRIC RATING
142nd/ 347
METRIC RANK
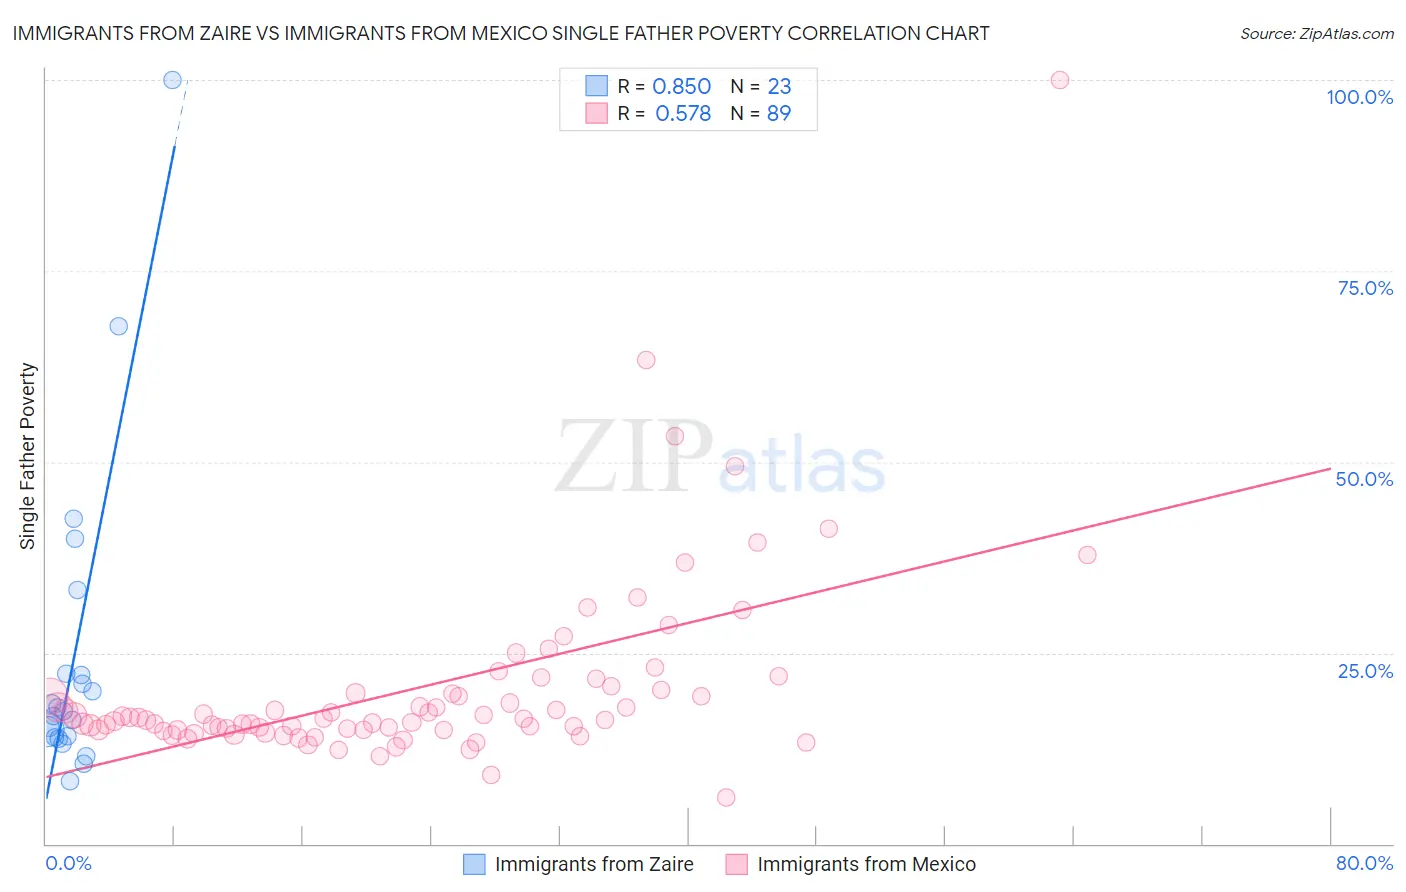
Immigrants from Zaire vs Immigrants from Mexico Single Father Poverty Correlation Chart
The statistical analysis conducted on geographies consisting of 97,955,340 people shows a very strong positive correlation between the proportion of Immigrants from Zaire and poverty level among single fathers in the United States with a correlation coefficient (R) of 0.850 and weighted average of 17.3%. Similarly, the statistical analysis conducted on geographies consisting of 385,763,473 people shows a substantial positive correlation between the proportion of Immigrants from Mexico and poverty level among single fathers in the United States with a correlation coefficient (R) of 0.578 and weighted average of 16.0%, a difference of 8.0%.
Single Father Poverty Correlation Summary
| Measurement | Immigrants from Zaire | Immigrants from Mexico |
| Minimum | 8.2% | 6.0% |
| Maximum | 100.0% | 100.0% |
| Range | 91.8% | 94.0% |
| Mean | 24.8% | 20.3% |
| Median | 17.3% | 16.3% |
| Interquartile 25% (IQ1) | 14.0% | 14.9% |
| Interquartile 75% (IQ3) | 22.3% | 20.0% |
| Interquartile Range (IQR) | 8.3% | 5.1% |
| Standard Deviation (Sample) | 21.1% | 12.6% |
| Standard Deviation (Population) | 20.6% | 12.5% |
Similar Demographics by Single Father Poverty
Demographics Similar to Immigrants from Zaire by Single Father Poverty
In terms of single father poverty, the demographic groups most similar to Immigrants from Zaire are Lithuanian (17.3%, a difference of 0.010%), Swiss (17.3%, a difference of 0.13%), Slovene (17.3%, a difference of 0.22%), Polish (17.3%, a difference of 0.22%), and Jamaican (17.3%, a difference of 0.27%).
| Demographics | Rating | Rank | Single Father Poverty |
| Sierra Leoneans | 0.8 /100 | #255 | Tragic 17.2% |
| Immigrants | Haiti | 0.8 /100 | #256 | Tragic 17.2% |
| Immigrants | Albania | 0.7 /100 | #257 | Tragic 17.2% |
| Albanians | 0.7 /100 | #258 | Tragic 17.2% |
| Immigrants | Jamaica | 0.7 /100 | #259 | Tragic 17.2% |
| Spaniards | 0.6 /100 | #260 | Tragic 17.2% |
| Swiss | 0.5 /100 | #261 | Tragic 17.3% |
| Immigrants | Zaire | 0.4 /100 | #262 | Tragic 17.3% |
| Lithuanians | 0.4 /100 | #263 | Tragic 17.3% |
| Slovenes | 0.3 /100 | #264 | Tragic 17.3% |
| Poles | 0.3 /100 | #265 | Tragic 17.3% |
| Jamaicans | 0.3 /100 | #266 | Tragic 17.3% |
| Haitians | 0.3 /100 | #267 | Tragic 17.3% |
| Immigrants | Caribbean | 0.3 /100 | #268 | Tragic 17.4% |
| Slavs | 0.3 /100 | #269 | Tragic 17.4% |
Demographics Similar to Immigrants from Mexico by Single Father Poverty
In terms of single father poverty, the demographic groups most similar to Immigrants from Mexico are Liberian (16.0%, a difference of 0.0%), Immigrants from Central America (16.0%, a difference of 0.020%), Immigrants from Kuwait (16.0%, a difference of 0.15%), Immigrants from Netherlands (16.0%, a difference of 0.17%), and Immigrants from Western Asia (16.0%, a difference of 0.20%).
| Demographics | Rating | Rank | Single Father Poverty |
| Immigrants | Sri Lanka | 88.2 /100 | #135 | Excellent 15.9% |
| Cypriots | 87.5 /100 | #136 | Excellent 15.9% |
| Immigrants | Azores | 87.2 /100 | #137 | Excellent 15.9% |
| Central Americans | 87.1 /100 | #138 | Excellent 16.0% |
| South Americans | 85.9 /100 | #139 | Excellent 16.0% |
| Immigrants | Netherlands | 85.3 /100 | #140 | Excellent 16.0% |
| Liberians | 83.3 /100 | #141 | Excellent 16.0% |
| Immigrants | Mexico | 83.3 /100 | #142 | Excellent 16.0% |
| Immigrants | Central America | 83.1 /100 | #143 | Excellent 16.0% |
| Immigrants | Kuwait | 81.4 /100 | #144 | Excellent 16.0% |
| Immigrants | Western Asia | 80.7 /100 | #145 | Excellent 16.0% |
| Immigrants | Hungary | 78.3 /100 | #146 | Good 16.1% |
| Colombians | 77.1 /100 | #147 | Good 16.1% |
| Nigerians | 76.8 /100 | #148 | Good 16.1% |
| South Africans | 75.1 /100 | #149 | Good 16.1% |