Immigrants from West Indies vs Israeli Child Poverty Under the Age of 16
COMPARE
Immigrants from West Indies
Israeli
Child Poverty Under the Age of 16
Child Poverty Under the Age of 16 Comparison
Immigrants from West Indies
Israelis
20.2%
CHILD POVERTY UNDER THE AGE OF 16
0.0/ 100
METRIC RATING
286th/ 347
METRIC RANK
15.5%
CHILD POVERTY UNDER THE AGE OF 16
80.1/ 100
METRIC RATING
149th/ 347
METRIC RANK
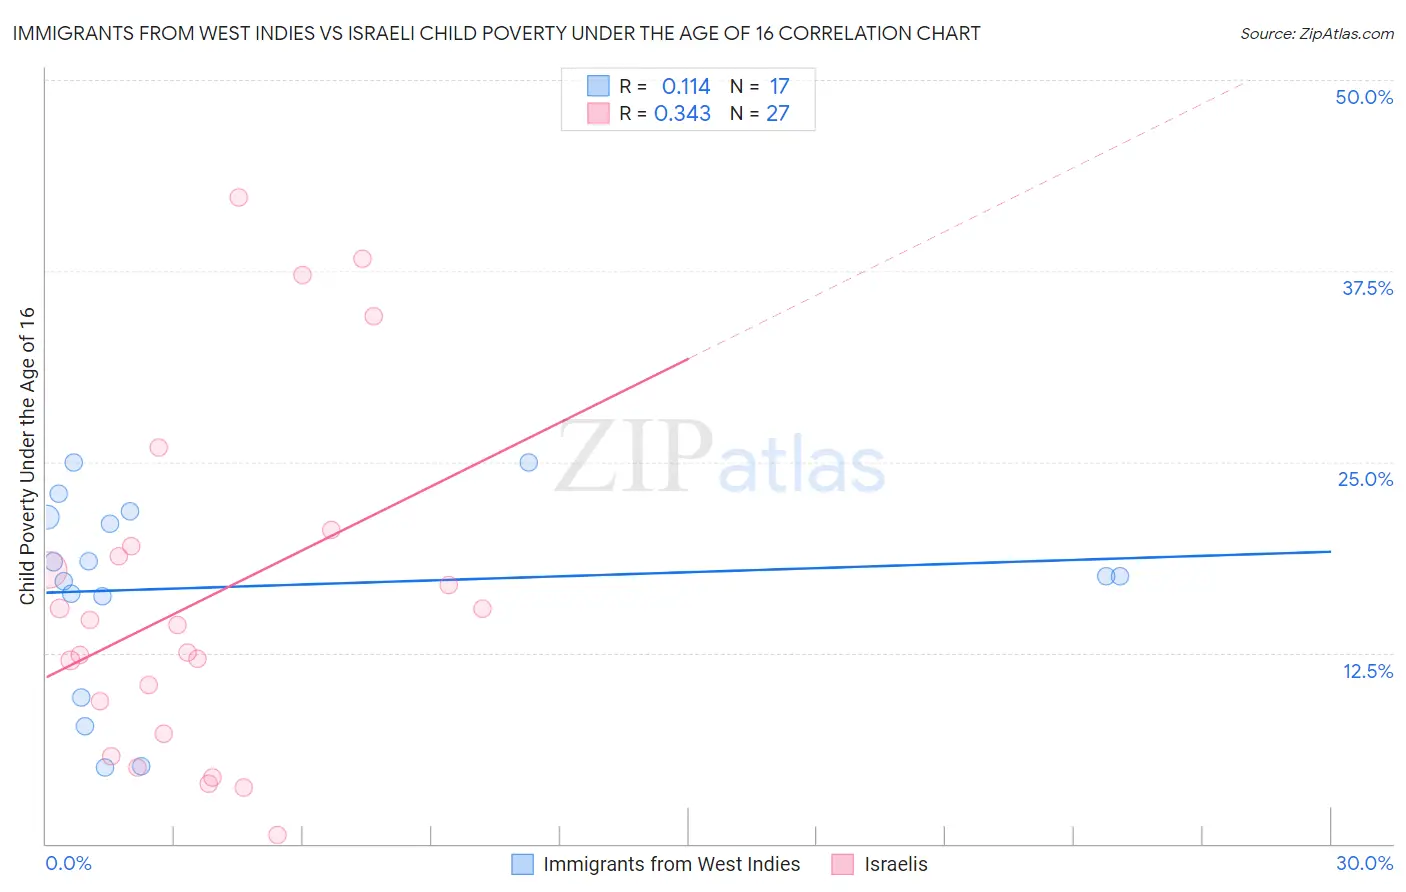
Immigrants from West Indies vs Israeli Child Poverty Under the Age of 16 Correlation Chart
The statistical analysis conducted on geographies consisting of 72,404,879 people shows a poor positive correlation between the proportion of Immigrants from West Indies and poverty level among children under the age of 16 in the United States with a correlation coefficient (R) of 0.114 and weighted average of 20.2%. Similarly, the statistical analysis conducted on geographies consisting of 209,541,802 people shows a mild positive correlation between the proportion of Israelis and poverty level among children under the age of 16 in the United States with a correlation coefficient (R) of 0.343 and weighted average of 15.5%, a difference of 29.9%.
Child Poverty Under the Age of 16 Correlation Summary
| Measurement | Immigrants from West Indies | Israeli |
| Minimum | 5.0% | 0.61% |
| Maximum | 25.0% | 42.3% |
| Range | 20.0% | 41.7% |
| Mean | 16.8% | 16.0% |
| Median | 17.5% | 14.3% |
| Interquartile 25% (IQ1) | 12.9% | 7.2% |
| Interquartile 75% (IQ3) | 21.6% | 19.5% |
| Interquartile Range (IQR) | 8.6% | 12.3% |
| Standard Deviation (Sample) | 6.4% | 11.2% |
| Standard Deviation (Population) | 6.2% | 10.9% |
Similar Demographics by Child Poverty Under the Age of 16
Demographics Similar to Immigrants from West Indies by Child Poverty Under the Age of 16
In terms of child poverty under the age of 16, the demographic groups most similar to Immigrants from West Indies are Blackfeet (20.2%, a difference of 0.12%), Immigrants from St. Vincent and the Grenadines (20.1%, a difference of 0.14%), West Indian (20.1%, a difference of 0.20%), Immigrants from Zaire (20.1%, a difference of 0.35%), and Barbadian (20.0%, a difference of 0.57%).
| Demographics | Rating | Rank | Child Poverty Under the Age of 16 |
| Sub-Saharan Africans | 0.0 /100 | #279 | Tragic 19.9% |
| Comanche | 0.0 /100 | #280 | Tragic 19.9% |
| Central Americans | 0.0 /100 | #281 | Tragic 20.0% |
| Barbadians | 0.0 /100 | #282 | Tragic 20.0% |
| Immigrants | Zaire | 0.0 /100 | #283 | Tragic 20.1% |
| West Indians | 0.0 /100 | #284 | Tragic 20.1% |
| Immigrants | St. Vincent and the Grenadines | 0.0 /100 | #285 | Tragic 20.1% |
| Immigrants | West Indies | 0.0 /100 | #286 | Tragic 20.2% |
| Blackfeet | 0.0 /100 | #287 | Tragic 20.2% |
| Immigrants | Belize | 0.0 /100 | #288 | Tragic 20.3% |
| Senegalese | 0.0 /100 | #289 | Tragic 20.4% |
| Yaqui | 0.0 /100 | #290 | Tragic 20.4% |
| Chippewa | 0.0 /100 | #291 | Tragic 20.5% |
| Immigrants | Latin America | 0.0 /100 | #292 | Tragic 20.5% |
| Immigrants | Senegal | 0.0 /100 | #293 | Tragic 20.6% |
Demographics Similar to Israelis by Child Poverty Under the Age of 16
In terms of child poverty under the age of 16, the demographic groups most similar to Israelis are Puget Sound Salish (15.5%, a difference of 0.040%), Immigrants from Kuwait (15.5%, a difference of 0.070%), Slovak (15.5%, a difference of 0.27%), Immigrants from Peru (15.5%, a difference of 0.31%), and Immigrants from Jordan (15.6%, a difference of 0.32%).
| Demographics | Rating | Rank | Child Poverty Under the Age of 16 |
| Brazilians | 82.8 /100 | #142 | Excellent 15.4% |
| Icelanders | 82.5 /100 | #143 | Excellent 15.4% |
| Immigrants | Hungary | 81.9 /100 | #144 | Excellent 15.5% |
| Immigrants | Peru | 81.7 /100 | #145 | Excellent 15.5% |
| Slovaks | 81.4 /100 | #146 | Excellent 15.5% |
| Immigrants | Kuwait | 80.5 /100 | #147 | Excellent 15.5% |
| Puget Sound Salish | 80.3 /100 | #148 | Excellent 15.5% |
| Israelis | 80.1 /100 | #149 | Excellent 15.5% |
| Immigrants | Jordan | 78.5 /100 | #150 | Good 15.6% |
| French | 78.5 /100 | #151 | Good 15.6% |
| French Canadians | 78.2 /100 | #152 | Good 15.6% |
| Venezuelans | 77.4 /100 | #153 | Good 15.6% |
| Samoans | 77.3 /100 | #154 | Good 15.6% |
| Syrians | 76.1 /100 | #155 | Good 15.6% |
| Immigrants | Venezuela | 74.9 /100 | #156 | Good 15.7% |