Immigrants from Vietnam vs Guyanese Female Poverty Among 18-24 Year Olds
COMPARE
Immigrants from Vietnam
Guyanese
Female Poverty Among 18-24 Year Olds
Female Poverty Among 18-24 Year Olds Comparison
Immigrants from Vietnam
Guyanese
17.8%
FEMALE POVERTY AMONG 18-24 YEAR OLDS
100.0/ 100
METRIC RATING
31st/ 347
METRIC RANK
19.4%
FEMALE POVERTY AMONG 18-24 YEAR OLDS
95.3/ 100
METRIC RATING
121st/ 347
METRIC RANK
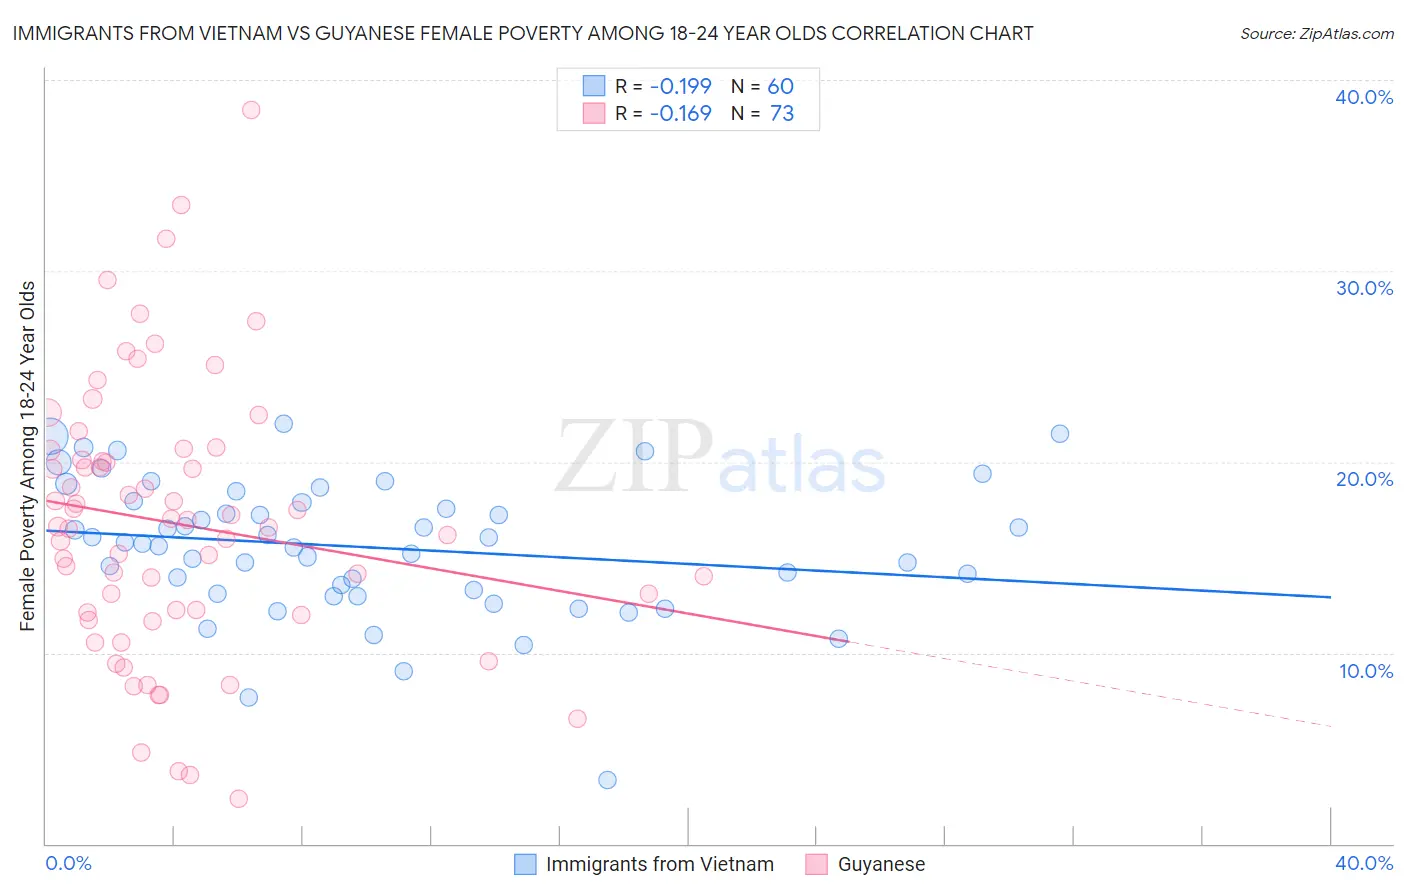
Immigrants from Vietnam vs Guyanese Female Poverty Among 18-24 Year Olds Correlation Chart
The statistical analysis conducted on geographies consisting of 396,080,445 people shows a poor negative correlation between the proportion of Immigrants from Vietnam and poverty level among females between the ages 18 and 24 in the United States with a correlation coefficient (R) of -0.199 and weighted average of 17.8%. Similarly, the statistical analysis conducted on geographies consisting of 174,590,010 people shows a poor negative correlation between the proportion of Guyanese and poverty level among females between the ages 18 and 24 in the United States with a correlation coefficient (R) of -0.169 and weighted average of 19.4%, a difference of 8.7%.
Female Poverty Among 18-24 Year Olds Correlation Summary
| Measurement | Immigrants from Vietnam | Guyanese |
| Minimum | 3.3% | 2.4% |
| Maximum | 22.0% | 38.4% |
| Range | 18.6% | 36.0% |
| Mean | 15.5% | 16.8% |
| Median | 15.7% | 16.6% |
| Interquartile 25% (IQ1) | 13.2% | 12.0% |
| Interquartile 75% (IQ3) | 17.9% | 20.4% |
| Interquartile Range (IQR) | 4.7% | 8.3% |
| Standard Deviation (Sample) | 3.6% | 7.1% |
| Standard Deviation (Population) | 3.6% | 7.0% |
Similar Demographics by Female Poverty Among 18-24 Year Olds
Demographics Similar to Immigrants from Vietnam by Female Poverty Among 18-24 Year Olds
In terms of female poverty among 18-24 year olds, the demographic groups most similar to Immigrants from Vietnam are Immigrants from South Eastern Asia (17.8%, a difference of 0.18%), Immigrants from Moldova (17.9%, a difference of 0.25%), Native Hawaiian (17.9%, a difference of 0.28%), Portuguese (17.8%, a difference of 0.36%), and Immigrants from Nicaragua (17.9%, a difference of 0.39%).
| Demographics | Rating | Rank | Female Poverty Among 18-24 Year Olds |
| Maltese | 100.0 /100 | #24 | Exceptional 17.6% |
| Immigrants | South Central Asia | 100.0 /100 | #25 | Exceptional 17.6% |
| Immigrants | Fiji | 100.0 /100 | #26 | Exceptional 17.7% |
| Colombians | 100.0 /100 | #27 | Exceptional 17.7% |
| Venezuelans | 100.0 /100 | #28 | Exceptional 17.7% |
| Portuguese | 100.0 /100 | #29 | Exceptional 17.8% |
| Immigrants | South Eastern Asia | 100.0 /100 | #30 | Exceptional 17.8% |
| Immigrants | Vietnam | 100.0 /100 | #31 | Exceptional 17.8% |
| Immigrants | Moldova | 100.0 /100 | #32 | Exceptional 17.9% |
| Native Hawaiians | 100.0 /100 | #33 | Exceptional 17.9% |
| Immigrants | Nicaragua | 100.0 /100 | #34 | Exceptional 17.9% |
| Immigrants | Greece | 100.0 /100 | #35 | Exceptional 17.9% |
| Immigrants | South America | 100.0 /100 | #36 | Exceptional 17.9% |
| Immigrants | Croatia | 100.0 /100 | #37 | Exceptional 17.9% |
| South Americans | 100.0 /100 | #38 | Exceptional 18.0% |
Demographics Similar to Guyanese by Female Poverty Among 18-24 Year Olds
In terms of female poverty among 18-24 year olds, the demographic groups most similar to Guyanese are Immigrants from Northern Europe (19.4%, a difference of 0.020%), Cypriot (19.3%, a difference of 0.070%), Immigrants from Guyana (19.3%, a difference of 0.090%), Immigrants from Iran (19.3%, a difference of 0.14%), and Immigrants (19.3%, a difference of 0.18%).
| Demographics | Rating | Rank | Female Poverty Among 18-24 Year Olds |
| Slovenes | 96.2 /100 | #114 | Exceptional 19.3% |
| Immigrants | Hungary | 96.2 /100 | #115 | Exceptional 19.3% |
| Immigrants | Immigrants | 95.9 /100 | #116 | Exceptional 19.3% |
| Immigrants | Iran | 95.8 /100 | #117 | Exceptional 19.3% |
| Immigrants | Guyana | 95.6 /100 | #118 | Exceptional 19.3% |
| Cypriots | 95.5 /100 | #119 | Exceptional 19.3% |
| Immigrants | Northern Europe | 95.4 /100 | #120 | Exceptional 19.4% |
| Guyanese | 95.3 /100 | #121 | Exceptional 19.4% |
| Cambodians | 94.6 /100 | #122 | Exceptional 19.4% |
| Paraguayans | 94.6 /100 | #123 | Exceptional 19.4% |
| Immigrants | Chile | 94.3 /100 | #124 | Exceptional 19.4% |
| Immigrants | Panama | 94.0 /100 | #125 | Exceptional 19.4% |
| Immigrants | Russia | 93.7 /100 | #126 | Exceptional 19.4% |
| Cape Verdeans | 93.6 /100 | #127 | Exceptional 19.4% |
| Slovaks | 92.9 /100 | #128 | Exceptional 19.5% |