Immigrants from Uganda vs Immigrants from Ghana Seniors Poverty Over the Age of 75
COMPARE
Immigrants from Uganda
Immigrants from Ghana
Seniors Poverty Over the Age of 75
Seniors Poverty Over the Age of 75 Comparison
Immigrants from Uganda
Immigrants from Ghana
11.8%
SENIORS POVERTY OVER THE AGE OF 75
84.8/ 100
METRIC RATING
119th/ 347
METRIC RANK
14.4%
SENIORS POVERTY OVER THE AGE OF 75
0.0/ 100
METRIC RATING
271st/ 347
METRIC RANK
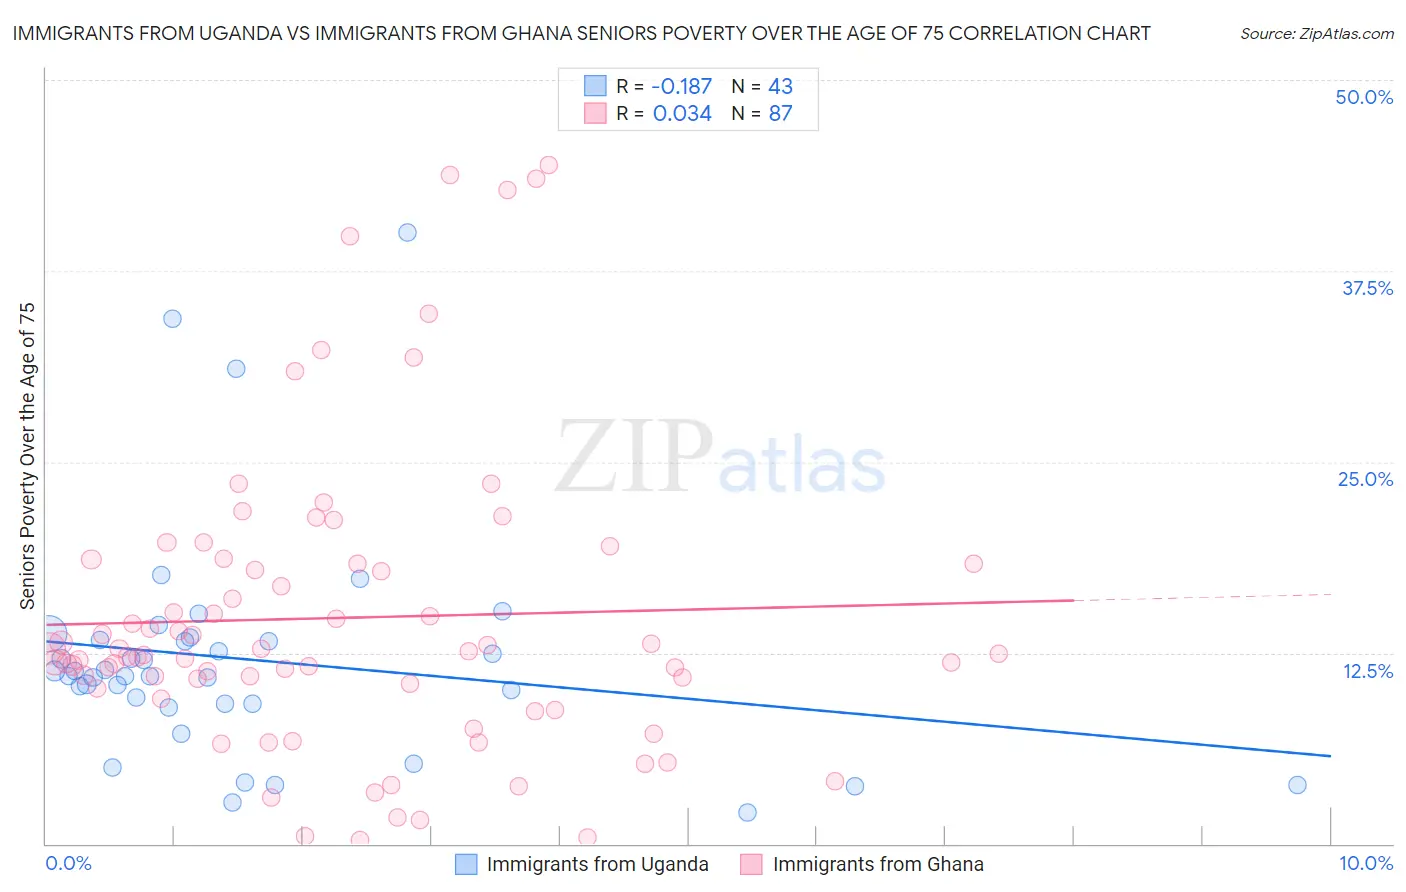
Immigrants from Uganda vs Immigrants from Ghana Seniors Poverty Over the Age of 75 Correlation Chart
The statistical analysis conducted on geographies consisting of 125,579,986 people shows a poor negative correlation between the proportion of Immigrants from Uganda and poverty level among seniors over the age of 75 in the United States with a correlation coefficient (R) of -0.187 and weighted average of 11.8%. Similarly, the statistical analysis conducted on geographies consisting of 198,360,562 people shows no correlation between the proportion of Immigrants from Ghana and poverty level among seniors over the age of 75 in the United States with a correlation coefficient (R) of 0.034 and weighted average of 14.4%, a difference of 22.1%.
Seniors Poverty Over the Age of 75 Correlation Summary
| Measurement | Immigrants from Uganda | Immigrants from Ghana |
| Minimum | 2.1% | 0.23% |
| Maximum | 40.0% | 44.4% |
| Range | 37.9% | 44.2% |
| Mean | 12.0% | 14.8% |
| Median | 11.0% | 12.5% |
| Interquartile 25% (IQ1) | 9.2% | 10.2% |
| Interquartile 75% (IQ3) | 13.4% | 18.3% |
| Interquartile Range (IQR) | 4.2% | 8.2% |
| Standard Deviation (Sample) | 7.5% | 9.8% |
| Standard Deviation (Population) | 7.4% | 9.8% |
Similar Demographics by Seniors Poverty Over the Age of 75
Demographics Similar to Immigrants from Uganda by Seniors Poverty Over the Age of 75
In terms of seniors poverty over the age of 75, the demographic groups most similar to Immigrants from Uganda are Immigrants from Nepal (11.8%, a difference of 0.040%), Malaysian (11.8%, a difference of 0.11%), Pakistani (11.8%, a difference of 0.12%), Immigrants from Italy (11.8%, a difference of 0.12%), and Immigrants from Zimbabwe (11.7%, a difference of 0.13%).
| Demographics | Rating | Rank | Seniors Poverty Over the Age of 75 |
| Immigrants | Bolivia | 88.4 /100 | #112 | Excellent 11.7% |
| Immigrants | Czechoslovakia | 87.0 /100 | #113 | Excellent 11.7% |
| Ukrainians | 86.9 /100 | #114 | Excellent 11.7% |
| New Zealanders | 86.3 /100 | #115 | Excellent 11.7% |
| Iraqis | 86.3 /100 | #116 | Excellent 11.7% |
| Icelanders | 85.7 /100 | #117 | Excellent 11.7% |
| Immigrants | Zimbabwe | 85.5 /100 | #118 | Excellent 11.7% |
| Immigrants | Uganda | 84.8 /100 | #119 | Excellent 11.8% |
| Immigrants | Nepal | 84.5 /100 | #120 | Excellent 11.8% |
| Malaysians | 84.1 /100 | #121 | Excellent 11.8% |
| Pakistanis | 84.0 /100 | #122 | Excellent 11.8% |
| Immigrants | Italy | 84.0 /100 | #123 | Excellent 11.8% |
| Fijians | 83.8 /100 | #124 | Excellent 11.8% |
| Sudanese | 83.6 /100 | #125 | Excellent 11.8% |
| Pennsylvania Germans | 83.4 /100 | #126 | Excellent 11.8% |
Demographics Similar to Immigrants from Ghana by Seniors Poverty Over the Age of 75
In terms of seniors poverty over the age of 75, the demographic groups most similar to Immigrants from Ghana are Mexican (14.4%, a difference of 0.11%), Immigrants from South America (14.4%, a difference of 0.33%), Immigrants from Uruguay (14.3%, a difference of 0.48%), Immigrants from Bahamas (14.4%, a difference of 0.50%), and Immigrants from Venezuela (14.3%, a difference of 0.62%).
| Demographics | Rating | Rank | Seniors Poverty Over the Age of 75 |
| South Americans | 0.0 /100 | #264 | Tragic 14.1% |
| Salvadorans | 0.0 /100 | #265 | Tragic 14.2% |
| Armenians | 0.0 /100 | #266 | Tragic 14.2% |
| Venezuelans | 0.0 /100 | #267 | Tragic 14.2% |
| Colombians | 0.0 /100 | #268 | Tragic 14.3% |
| Immigrants | Venezuela | 0.0 /100 | #269 | Tragic 14.3% |
| Immigrants | Uruguay | 0.0 /100 | #270 | Tragic 14.3% |
| Immigrants | Ghana | 0.0 /100 | #271 | Tragic 14.4% |
| Mexicans | 0.0 /100 | #272 | Tragic 14.4% |
| Immigrants | South America | 0.0 /100 | #273 | Tragic 14.4% |
| Immigrants | Bahamas | 0.0 /100 | #274 | Tragic 14.4% |
| Immigrants | El Salvador | 0.0 /100 | #275 | Tragic 14.5% |
| Soviet Union | 0.0 /100 | #276 | Tragic 14.5% |
| Senegalese | 0.0 /100 | #277 | Tragic 14.5% |
| Immigrants | Colombia | 0.0 /100 | #278 | Tragic 14.6% |