Immigrants from Trinidad and Tobago vs Syrian Seniors Poverty Over the Age of 75
COMPARE
Immigrants from Trinidad and Tobago
Syrian
Seniors Poverty Over the Age of 75
Seniors Poverty Over the Age of 75 Comparison
Immigrants from Trinidad and Tobago
Syrians
15.7%
SENIORS POVERTY OVER THE AGE OF 75
0.0/ 100
METRIC RATING
304th/ 347
METRIC RANK
11.6%
SENIORS POVERTY OVER THE AGE OF 75
91.1/ 100
METRIC RATING
100th/ 347
METRIC RANK
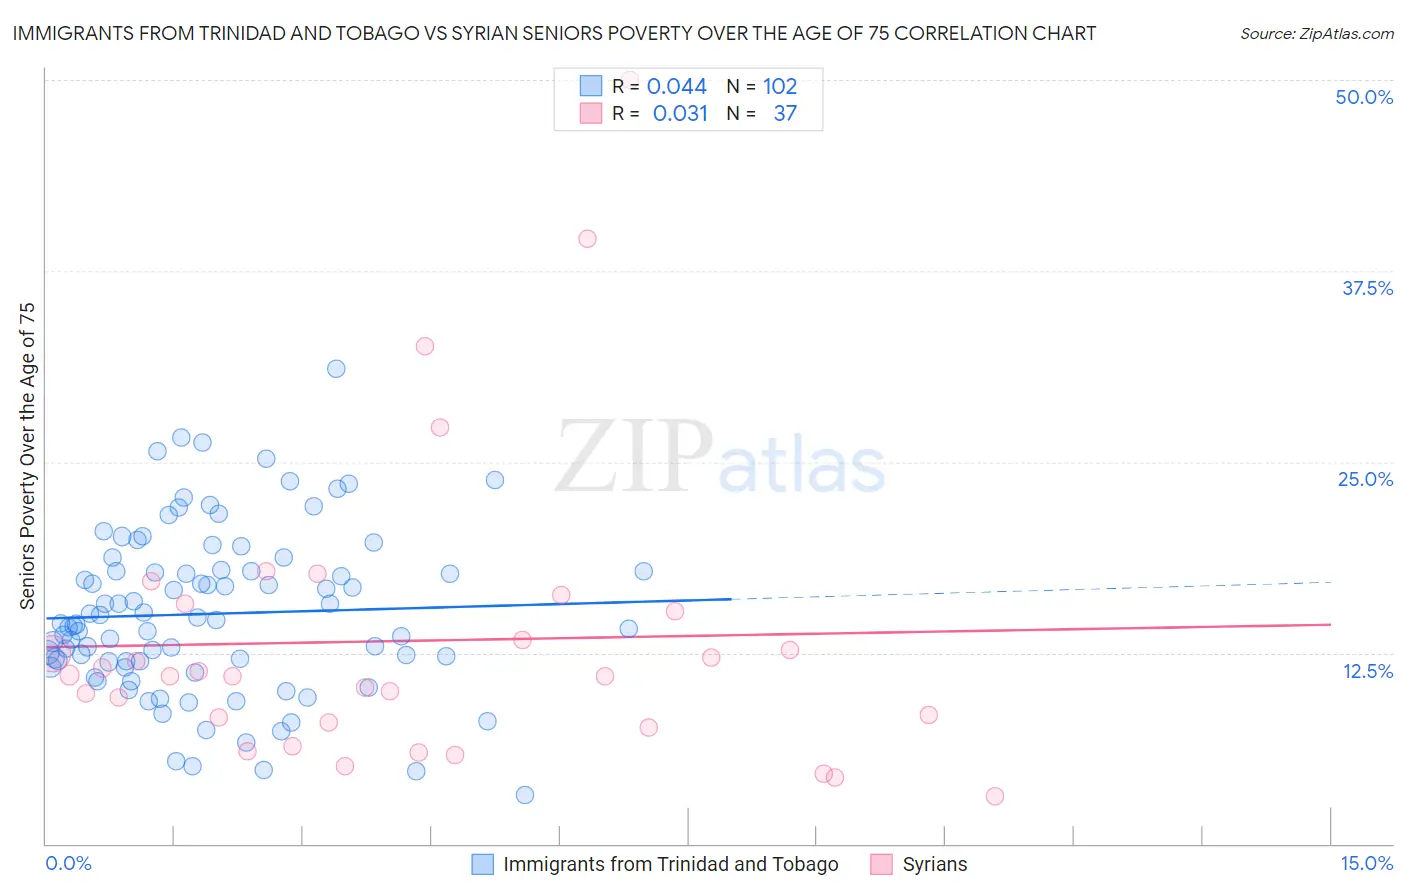
Immigrants from Trinidad and Tobago vs Syrian Seniors Poverty Over the Age of 75 Correlation Chart
The statistical analysis conducted on geographies consisting of 222,011,128 people shows no correlation between the proportion of Immigrants from Trinidad and Tobago and poverty level among seniors over the age of 75 in the United States with a correlation coefficient (R) of 0.044 and weighted average of 15.7%. Similarly, the statistical analysis conducted on geographies consisting of 264,328,222 people shows no correlation between the proportion of Syrians and poverty level among seniors over the age of 75 in the United States with a correlation coefficient (R) of 0.031 and weighted average of 11.6%, a difference of 35.5%.
Seniors Poverty Over the Age of 75 Correlation Summary
| Measurement | Immigrants from Trinidad and Tobago | Syrian |
| Minimum | 3.2% | 3.1% |
| Maximum | 31.1% | 50.0% |
| Range | 27.9% | 46.9% |
| Mean | 15.1% | 13.3% |
| Median | 14.4% | 11.0% |
| Interquartile 25% (IQ1) | 11.9% | 7.8% |
| Interquartile 75% (IQ3) | 17.8% | 15.5% |
| Interquartile Range (IQR) | 5.9% | 7.7% |
| Standard Deviation (Sample) | 5.4% | 9.7% |
| Standard Deviation (Population) | 5.4% | 9.6% |
Similar Demographics by Seniors Poverty Over the Age of 75
Demographics Similar to Immigrants from Trinidad and Tobago by Seniors Poverty Over the Age of 75
In terms of seniors poverty over the age of 75, the demographic groups most similar to Immigrants from Trinidad and Tobago are Ecuadorian (15.7%, a difference of 0.040%), Immigrants from Honduras (15.7%, a difference of 0.18%), Hispanic or Latino (15.8%, a difference of 0.20%), Immigrants from West Indies (15.8%, a difference of 0.34%), and West Indian (15.7%, a difference of 0.35%).
| Demographics | Rating | Rank | Seniors Poverty Over the Age of 75 |
| Hondurans | 0.0 /100 | #297 | Tragic 15.4% |
| Natives/Alaskans | 0.0 /100 | #298 | Tragic 15.5% |
| Spanish American Indians | 0.0 /100 | #299 | Tragic 15.5% |
| Bahamians | 0.0 /100 | #300 | Tragic 15.5% |
| Immigrants | Latin America | 0.0 /100 | #301 | Tragic 15.6% |
| West Indians | 0.0 /100 | #302 | Tragic 15.7% |
| Immigrants | Honduras | 0.0 /100 | #303 | Tragic 15.7% |
| Immigrants | Trinidad and Tobago | 0.0 /100 | #304 | Tragic 15.7% |
| Ecuadorians | 0.0 /100 | #305 | Tragic 15.7% |
| Hispanics or Latinos | 0.0 /100 | #306 | Tragic 15.8% |
| Immigrants | West Indies | 0.0 /100 | #307 | Tragic 15.8% |
| Immigrants | Bangladesh | 0.0 /100 | #308 | Tragic 15.8% |
| Yup'ik | 0.0 /100 | #309 | Tragic 15.8% |
| Vietnamese | 0.0 /100 | #310 | Tragic 15.9% |
| Trinidadians and Tobagonians | 0.0 /100 | #311 | Tragic 15.9% |
Demographics Similar to Syrians by Seniors Poverty Over the Age of 75
In terms of seniors poverty over the age of 75, the demographic groups most similar to Syrians are Jordanian (11.6%, a difference of 0.080%), Guamanian/Chamorro (11.6%, a difference of 0.12%), Immigrants from Ethiopia (11.6%, a difference of 0.16%), Immigrants from Kuwait (11.6%, a difference of 0.16%), and Immigrants from Singapore (11.6%, a difference of 0.21%).
| Demographics | Rating | Rank | Seniors Poverty Over the Age of 75 |
| Immigrants | Poland | 92.9 /100 | #93 | Exceptional 11.6% |
| Creek | 92.7 /100 | #94 | Exceptional 11.6% |
| Immigrants | Bosnia and Herzegovina | 92.6 /100 | #95 | Exceptional 11.6% |
| Immigrants | Sweden | 92.6 /100 | #96 | Exceptional 11.6% |
| Romanians | 92.3 /100 | #97 | Exceptional 11.6% |
| Immigrants | Japan | 91.9 /100 | #98 | Exceptional 11.6% |
| Immigrants | Ethiopia | 91.7 /100 | #99 | Exceptional 11.6% |
| Syrians | 91.1 /100 | #100 | Exceptional 11.6% |
| Jordanians | 90.8 /100 | #101 | Exceptional 11.6% |
| Guamanians/Chamorros | 90.6 /100 | #102 | Exceptional 11.6% |
| Immigrants | Kuwait | 90.5 /100 | #103 | Exceptional 11.6% |
| Immigrants | Singapore | 90.3 /100 | #104 | Exceptional 11.6% |
| Chickasaw | 90.2 /100 | #105 | Exceptional 11.6% |
| Russians | 89.9 /100 | #106 | Excellent 11.6% |
| Immigrants | Oceania | 89.4 /100 | #107 | Excellent 11.7% |