Immigrants from Thailand vs British West Indian Seniors Poverty Over the Age of 75
COMPARE
Immigrants from Thailand
British West Indian
Seniors Poverty Over the Age of 75
Seniors Poverty Over the Age of 75 Comparison
Immigrants from Thailand
British West Indians
12.2%
SENIORS POVERTY OVER THE AGE OF 75
52.0/ 100
METRIC RATING
170th/ 347
METRIC RANK
17.4%
SENIORS POVERTY OVER THE AGE OF 75
0.0/ 100
METRIC RATING
330th/ 347
METRIC RANK
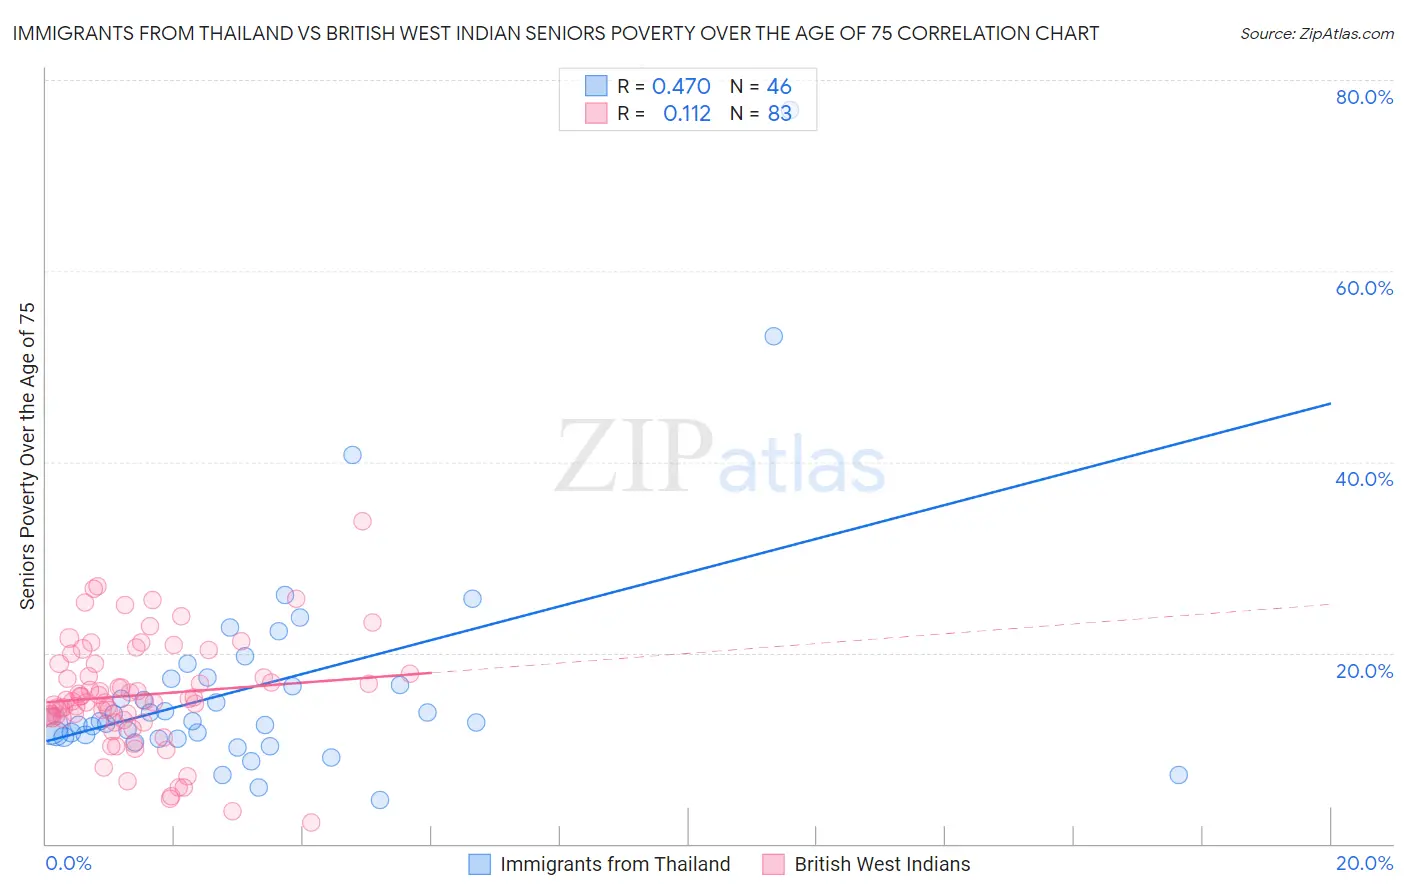
Immigrants from Thailand vs British West Indian Seniors Poverty Over the Age of 75 Correlation Chart
The statistical analysis conducted on geographies consisting of 314,343,906 people shows a moderate positive correlation between the proportion of Immigrants from Thailand and poverty level among seniors over the age of 75 in the United States with a correlation coefficient (R) of 0.470 and weighted average of 12.2%. Similarly, the statistical analysis conducted on geographies consisting of 151,930,875 people shows a poor positive correlation between the proportion of British West Indians and poverty level among seniors over the age of 75 in the United States with a correlation coefficient (R) of 0.112 and weighted average of 17.4%, a difference of 43.1%.
Seniors Poverty Over the Age of 75 Correlation Summary
| Measurement | Immigrants from Thailand | British West Indian |
| Minimum | 4.5% | 2.3% |
| Maximum | 76.9% | 33.8% |
| Range | 72.4% | 31.5% |
| Mean | 16.6% | 15.6% |
| Median | 12.8% | 14.9% |
| Interquartile 25% (IQ1) | 11.2% | 13.2% |
| Interquartile 75% (IQ3) | 17.2% | 18.8% |
| Interquartile Range (IQR) | 6.1% | 5.7% |
| Standard Deviation (Sample) | 12.4% | 5.7% |
| Standard Deviation (Population) | 12.3% | 5.7% |
Similar Demographics by Seniors Poverty Over the Age of 75
Demographics Similar to Immigrants from Thailand by Seniors Poverty Over the Age of 75
In terms of seniors poverty over the age of 75, the demographic groups most similar to Immigrants from Thailand are Spaniard (12.2%, a difference of 0.030%), Immigrants from Fiji (12.2%, a difference of 0.040%), Arab (12.2%, a difference of 0.13%), Immigrants from Egypt (12.2%, a difference of 0.14%), and Immigrants from Syria (12.2%, a difference of 0.15%).
| Demographics | Rating | Rank | Seniors Poverty Over the Age of 75 |
| Immigrants | Greece | 58.2 /100 | #163 | Average 12.1% |
| Potawatomi | 57.4 /100 | #164 | Average 12.1% |
| Okinawans | 56.3 /100 | #165 | Average 12.1% |
| Egyptians | 54.8 /100 | #166 | Average 12.1% |
| Immigrants | Switzerland | 54.5 /100 | #167 | Average 12.1% |
| Immigrants | Syria | 53.9 /100 | #168 | Average 12.2% |
| Immigrants | Egypt | 53.7 /100 | #169 | Average 12.2% |
| Immigrants | Thailand | 52.0 /100 | #170 | Average 12.2% |
| Spaniards | 51.6 /100 | #171 | Average 12.2% |
| Immigrants | Fiji | 51.5 /100 | #172 | Average 12.2% |
| Arabs | 50.5 /100 | #173 | Average 12.2% |
| Immigrants | Europe | 50.0 /100 | #174 | Average 12.2% |
| Immigrants | Saudi Arabia | 49.5 /100 | #175 | Average 12.2% |
| Immigrants | Iran | 48.1 /100 | #176 | Average 12.2% |
| Immigrants | Asia | 47.8 /100 | #177 | Average 12.2% |
Demographics Similar to British West Indians by Seniors Poverty Over the Age of 75
In terms of seniors poverty over the age of 75, the demographic groups most similar to British West Indians are Immigrants from Armenia (17.5%, a difference of 0.26%), Immigrants from St. Vincent and the Grenadines (17.5%, a difference of 0.52%), Immigrants from Nicaragua (17.6%, a difference of 0.99%), Immigrants from Dominica (17.0%, a difference of 2.4%), and Immigrants from Grenada (17.8%, a difference of 2.5%).
| Demographics | Rating | Rank | Seniors Poverty Over the Age of 75 |
| Central American Indians | 0.0 /100 | #323 | Tragic 16.5% |
| Immigrants | Uzbekistan | 0.0 /100 | #324 | Tragic 16.5% |
| Nicaraguans | 0.0 /100 | #325 | Tragic 16.6% |
| Pueblo | 0.0 /100 | #326 | Tragic 16.7% |
| Sioux | 0.0 /100 | #327 | Tragic 16.8% |
| Cape Verdeans | 0.0 /100 | #328 | Tragic 16.8% |
| Immigrants | Dominica | 0.0 /100 | #329 | Tragic 17.0% |
| British West Indians | 0.0 /100 | #330 | Tragic 17.4% |
| Immigrants | Armenia | 0.0 /100 | #331 | Tragic 17.5% |
| Immigrants | St. Vincent and the Grenadines | 0.0 /100 | #332 | Tragic 17.5% |
| Immigrants | Nicaragua | 0.0 /100 | #333 | Tragic 17.6% |
| Immigrants | Grenada | 0.0 /100 | #334 | Tragic 17.8% |
| Cubans | 0.0 /100 | #335 | Tragic 18.0% |
| Immigrants | Caribbean | 0.0 /100 | #336 | Tragic 18.2% |
| Yakama | 0.0 /100 | #337 | Tragic 18.3% |