Immigrants from Syria vs Egyptian Family Poverty
COMPARE
Immigrants from Syria
Egyptian
Family Poverty
Family Poverty Comparison
Immigrants from Syria
Egyptians
9.0%
FAMILY POVERTY
47.5/ 100
METRIC RATING
176th/ 347
METRIC RANK
8.1%
FAMILY POVERTY
95.1/ 100
METRIC RATING
106th/ 347
METRIC RANK
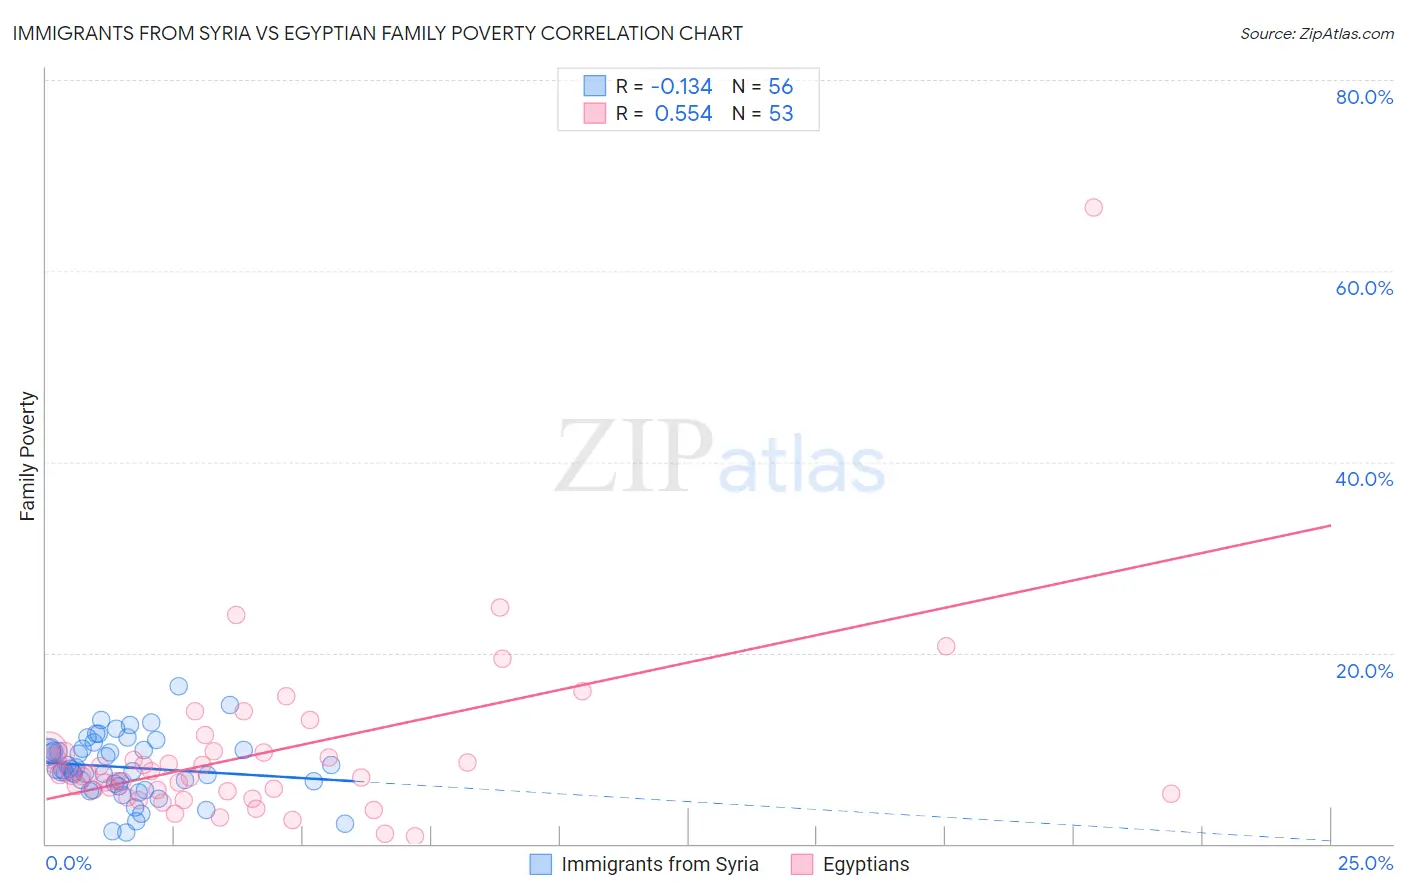
Immigrants from Syria vs Egyptian Family Poverty Correlation Chart
The statistical analysis conducted on geographies consisting of 173,889,011 people shows a poor negative correlation between the proportion of Immigrants from Syria and poverty level among families in the United States with a correlation coefficient (R) of -0.134 and weighted average of 9.0%. Similarly, the statistical analysis conducted on geographies consisting of 276,431,848 people shows a substantial positive correlation between the proportion of Egyptians and poverty level among families in the United States with a correlation coefficient (R) of 0.554 and weighted average of 8.1%, a difference of 11.1%.
Family Poverty Correlation Summary
| Measurement | Immigrants from Syria | Egyptian |
| Minimum | 1.2% | 0.78% |
| Maximum | 16.4% | 66.7% |
| Range | 15.2% | 65.9% |
| Mean | 8.0% | 9.5% |
| Median | 7.7% | 7.2% |
| Interquartile 25% (IQ1) | 6.2% | 5.4% |
| Interquartile 75% (IQ3) | 9.8% | 9.6% |
| Interquartile Range (IQR) | 3.7% | 4.3% |
| Standard Deviation (Sample) | 3.2% | 9.5% |
| Standard Deviation (Population) | 3.2% | 9.4% |
Similar Demographics by Family Poverty
Demographics Similar to Immigrants from Syria by Family Poverty
In terms of family poverty, the demographic groups most similar to Immigrants from Syria are Hawaiian (9.0%, a difference of 0.030%), Immigrants from Cameroon (9.0%, a difference of 0.040%), Costa Rican (9.0%, a difference of 0.24%), Immigrants from Albania (9.0%, a difference of 0.33%), and Immigrants from Iraq (9.1%, a difference of 0.41%).
| Demographics | Rating | Rank | Family Poverty |
| Immigrants | Chile | 59.6 /100 | #169 | Average 8.9% |
| Kenyans | 58.2 /100 | #170 | Average 8.9% |
| Lebanese | 57.6 /100 | #171 | Average 8.9% |
| Immigrants | Peru | 57.5 /100 | #172 | Average 8.9% |
| Immigrants | Fiji | 56.4 /100 | #173 | Average 8.9% |
| Immigrants | Albania | 50.0 /100 | #174 | Average 9.0% |
| Costa Ricans | 49.3 /100 | #175 | Average 9.0% |
| Immigrants | Syria | 47.5 /100 | #176 | Average 9.0% |
| Hawaiians | 47.2 /100 | #177 | Average 9.0% |
| Immigrants | Cameroon | 47.1 /100 | #178 | Average 9.0% |
| Immigrants | Iraq | 44.4 /100 | #179 | Average 9.1% |
| Immigrants | Uganda | 43.4 /100 | #180 | Average 9.1% |
| Hmong | 40.2 /100 | #181 | Average 9.1% |
| Immigrants | Morocco | 40.2 /100 | #182 | Average 9.1% |
| Uruguayans | 39.2 /100 | #183 | Fair 9.1% |
Demographics Similar to Egyptians by Family Poverty
In terms of family poverty, the demographic groups most similar to Egyptians are French Canadian (8.1%, a difference of 0.040%), Basque (8.1%, a difference of 0.13%), Jordanian (8.2%, a difference of 0.22%), Romanian (8.2%, a difference of 0.31%), and Taiwanese (8.2%, a difference of 0.36%).
| Demographics | Rating | Rank | Family Poverty |
| Welsh | 95.8 /100 | #99 | Exceptional 8.1% |
| New Zealanders | 95.8 /100 | #100 | Exceptional 8.1% |
| Immigrants | Norway | 95.7 /100 | #101 | Exceptional 8.1% |
| Immigrants | Indonesia | 95.7 /100 | #102 | Exceptional 8.1% |
| Immigrants | Eastern Europe | 95.6 /100 | #103 | Exceptional 8.1% |
| Slavs | 95.6 /100 | #104 | Exceptional 8.1% |
| Laotians | 95.6 /100 | #105 | Exceptional 8.1% |
| Egyptians | 95.1 /100 | #106 | Exceptional 8.1% |
| French Canadians | 95.0 /100 | #107 | Exceptional 8.1% |
| Basques | 94.9 /100 | #108 | Exceptional 8.1% |
| Jordanians | 94.8 /100 | #109 | Exceptional 8.2% |
| Romanians | 94.7 /100 | #110 | Exceptional 8.2% |
| Taiwanese | 94.6 /100 | #111 | Exceptional 8.2% |
| Immigrants | France | 94.4 /100 | #112 | Exceptional 8.2% |
| Canadians | 94.2 /100 | #113 | Exceptional 8.2% |