Immigrants from St. Vincent and the Grenadines vs Immigrants from El Salvador Female Poverty Among 18-24 Year Olds
COMPARE
Immigrants from St. Vincent and the Grenadines
Immigrants from El Salvador
Female Poverty Among 18-24 Year Olds
Female Poverty Among 18-24 Year Olds Comparison
Immigrants from St. Vincent and the Grenadines
Immigrants from El Salvador
20.8%
FEMALE POVERTY AMONG 18-24 YEAR OLDS
6.0/ 100
METRIC RATING
231st/ 347
METRIC RANK
19.3%
FEMALE POVERTY AMONG 18-24 YEAR OLDS
96.5/ 100
METRIC RATING
112th/ 347
METRIC RANK
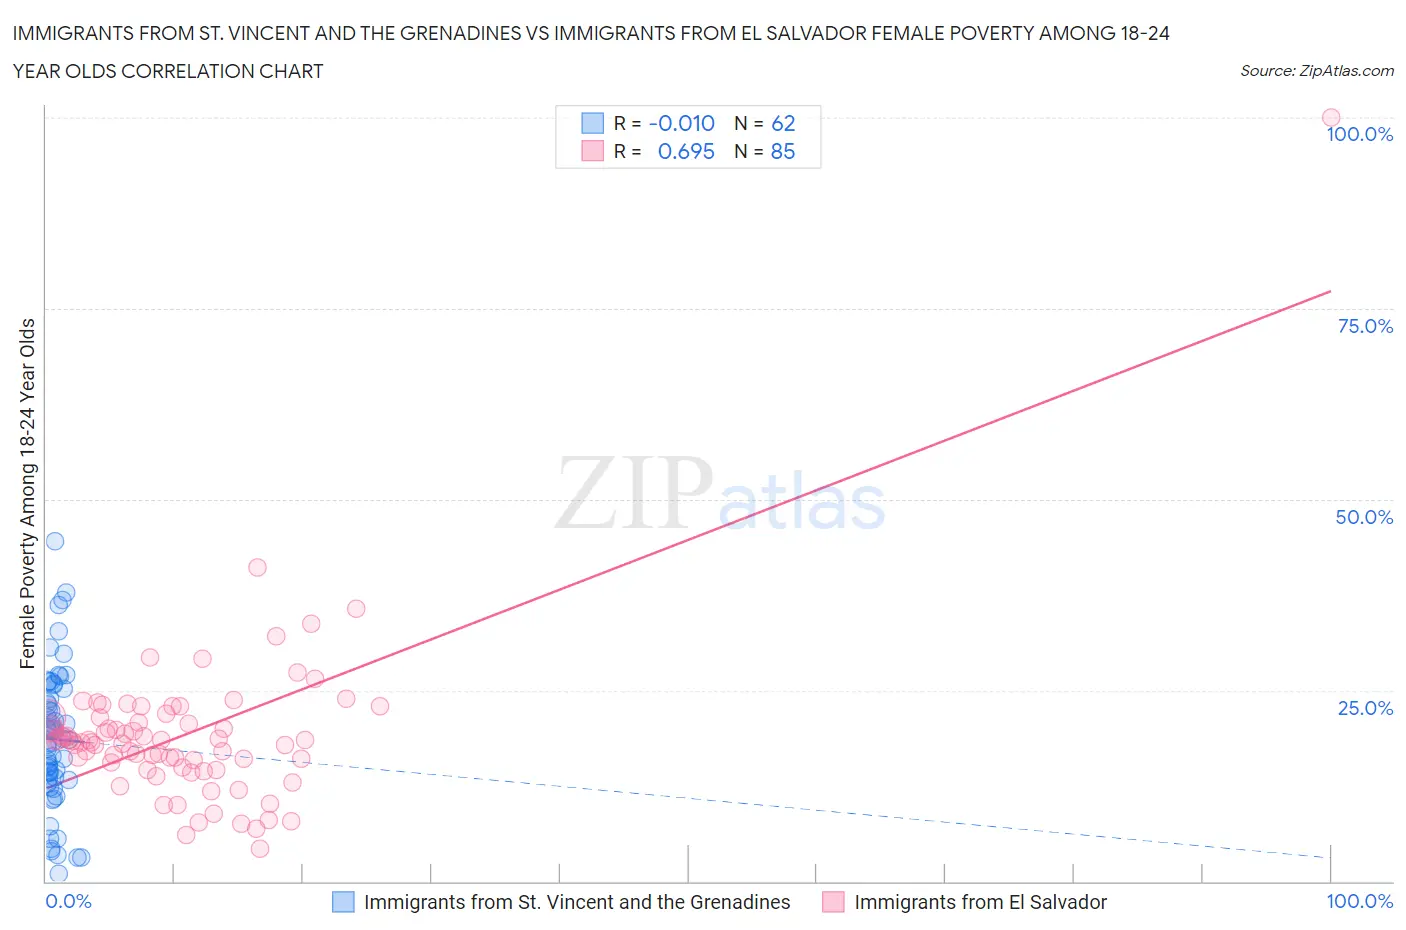
Immigrants from St. Vincent and the Grenadines vs Immigrants from El Salvador Female Poverty Among 18-24 Year Olds Correlation Chart
The statistical analysis conducted on geographies consisting of 56,017,716 people shows no correlation between the proportion of Immigrants from St. Vincent and the Grenadines and poverty level among females between the ages 18 and 24 in the United States with a correlation coefficient (R) of -0.010 and weighted average of 20.8%. Similarly, the statistical analysis conducted on geographies consisting of 351,639,009 people shows a significant positive correlation between the proportion of Immigrants from El Salvador and poverty level among females between the ages 18 and 24 in the United States with a correlation coefficient (R) of 0.695 and weighted average of 19.3%, a difference of 7.7%.
Female Poverty Among 18-24 Year Olds Correlation Summary
| Measurement | Immigrants from St. Vincent and the Grenadines | Immigrants from El Salvador |
| Minimum | 0.92% | 4.2% |
| Maximum | 44.4% | 100.0% |
| Range | 43.5% | 95.8% |
| Mean | 18.6% | 19.2% |
| Median | 18.3% | 18.4% |
| Interquartile 25% (IQ1) | 13.3% | 15.2% |
| Interquartile 75% (IQ3) | 25.2% | 21.5% |
| Interquartile Range (IQR) | 12.0% | 6.2% |
| Standard Deviation (Sample) | 9.2% | 10.9% |
| Standard Deviation (Population) | 9.2% | 10.9% |
Similar Demographics by Female Poverty Among 18-24 Year Olds
Demographics Similar to Immigrants from St. Vincent and the Grenadines by Female Poverty Among 18-24 Year Olds
In terms of female poverty among 18-24 year olds, the demographic groups most similar to Immigrants from St. Vincent and the Grenadines are Finnish (20.8%, a difference of 0.0%), White/Caucasian (20.8%, a difference of 0.020%), Australian (20.8%, a difference of 0.030%), Immigrants from Denmark (20.8%, a difference of 0.040%), and Ghanaian (20.8%, a difference of 0.090%).
| Demographics | Rating | Rank | Female Poverty Among 18-24 Year Olds |
| Immigrants | Liberia | 7.6 /100 | #224 | Tragic 20.7% |
| Norwegians | 7.3 /100 | #225 | Tragic 20.7% |
| Estonians | 7.2 /100 | #226 | Tragic 20.7% |
| Immigrants | Sweden | 6.8 /100 | #227 | Tragic 20.7% |
| Ghanaians | 6.5 /100 | #228 | Tragic 20.8% |
| Australians | 6.1 /100 | #229 | Tragic 20.8% |
| Whites/Caucasians | 6.1 /100 | #230 | Tragic 20.8% |
| Immigrants | St. Vincent and the Grenadines | 6.0 /100 | #231 | Tragic 20.8% |
| Finns | 6.0 /100 | #232 | Tragic 20.8% |
| Immigrants | Denmark | 5.8 /100 | #233 | Tragic 20.8% |
| Welsh | 5.4 /100 | #234 | Tragic 20.8% |
| Immigrants | Uganda | 5.1 /100 | #235 | Tragic 20.8% |
| Okinawans | 4.9 /100 | #236 | Tragic 20.8% |
| Scottish | 4.5 /100 | #237 | Tragic 20.9% |
| Immigrants | Singapore | 4.4 /100 | #238 | Tragic 20.9% |
Demographics Similar to Immigrants from El Salvador by Female Poverty Among 18-24 Year Olds
In terms of female poverty among 18-24 year olds, the demographic groups most similar to Immigrants from El Salvador are Immigrants from Cameroon (19.3%, a difference of 0.060%), Slovene (19.3%, a difference of 0.10%), Immigrants from Hungary (19.3%, a difference of 0.11%), Immigrants (19.3%, a difference of 0.22%), and Immigrants from Serbia (19.2%, a difference of 0.23%).
| Demographics | Rating | Rank | Female Poverty Among 18-24 Year Olds |
| Immigrants | Ecuador | 97.8 /100 | #105 | Exceptional 19.2% |
| Immigrants | Sierra Leone | 97.8 /100 | #106 | Exceptional 19.2% |
| Immigrants | Sri Lanka | 97.5 /100 | #107 | Exceptional 19.2% |
| Immigrants | Uzbekistan | 97.3 /100 | #108 | Exceptional 19.2% |
| Immigrants | Syria | 97.2 /100 | #109 | Exceptional 19.2% |
| Laotians | 97.1 /100 | #110 | Exceptional 19.2% |
| Immigrants | Serbia | 97.1 /100 | #111 | Exceptional 19.2% |
| Immigrants | El Salvador | 96.5 /100 | #112 | Exceptional 19.3% |
| Immigrants | Cameroon | 96.3 /100 | #113 | Exceptional 19.3% |
| Slovenes | 96.2 /100 | #114 | Exceptional 19.3% |
| Immigrants | Hungary | 96.2 /100 | #115 | Exceptional 19.3% |
| Immigrants | Immigrants | 95.9 /100 | #116 | Exceptional 19.3% |
| Immigrants | Iran | 95.8 /100 | #117 | Exceptional 19.3% |
| Immigrants | Guyana | 95.6 /100 | #118 | Exceptional 19.3% |
| Cypriots | 95.5 /100 | #119 | Exceptional 19.3% |