Immigrants from St. Vincent and the Grenadines vs Immigrants from Canada Child Poverty Under the Age of 16
COMPARE
Immigrants from St. Vincent and the Grenadines
Immigrants from Canada
Child Poverty Under the Age of 16
Child Poverty Under the Age of 16 Comparison
Immigrants from St. Vincent and the Grenadines
Immigrants from Canada
20.1%
CHILD POVERTY UNDER THE AGE OF 16
0.0/ 100
METRIC RATING
285th/ 347
METRIC RANK
14.5%
CHILD POVERTY UNDER THE AGE OF 16
97.2/ 100
METRIC RATING
82nd/ 347
METRIC RANK
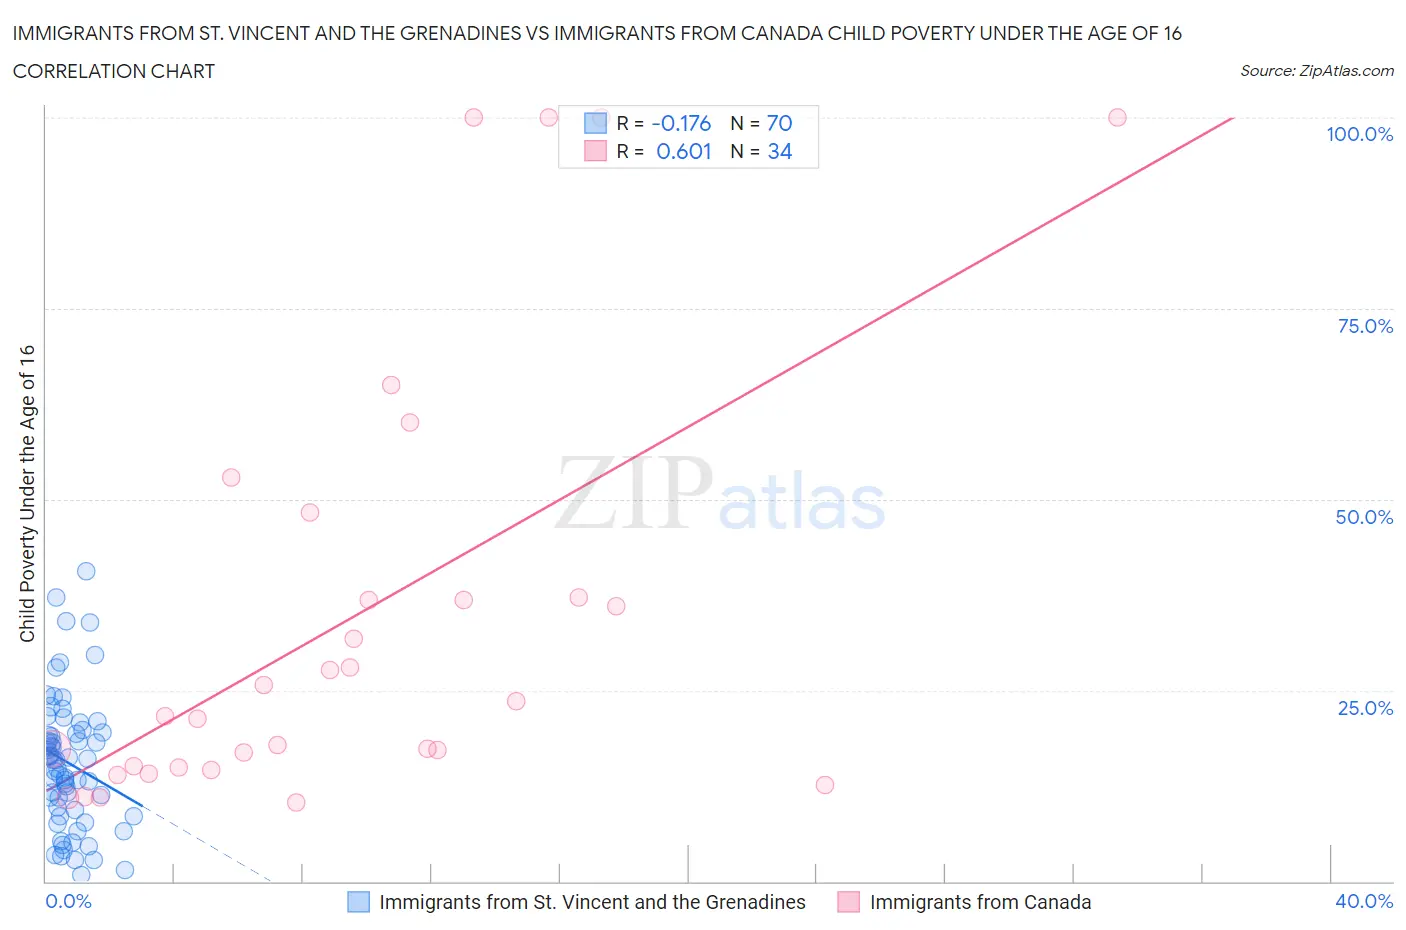
Immigrants from St. Vincent and the Grenadines vs Immigrants from Canada Child Poverty Under the Age of 16 Correlation Chart
The statistical analysis conducted on geographies consisting of 56,141,906 people shows a poor negative correlation between the proportion of Immigrants from St. Vincent and the Grenadines and poverty level among children under the age of 16 in the United States with a correlation coefficient (R) of -0.176 and weighted average of 20.1%. Similarly, the statistical analysis conducted on geographies consisting of 452,889,147 people shows a significant positive correlation between the proportion of Immigrants from Canada and poverty level among children under the age of 16 in the United States with a correlation coefficient (R) of 0.601 and weighted average of 14.5%, a difference of 39.1%.
Child Poverty Under the Age of 16 Correlation Summary
| Measurement | Immigrants from St. Vincent and the Grenadines | Immigrants from Canada |
| Minimum | 0.78% | 10.3% |
| Maximum | 40.6% | 100.0% |
| Range | 39.9% | 89.7% |
| Mean | 15.5% | 34.3% |
| Median | 15.9% | 22.6% |
| Interquartile 25% (IQ1) | 9.4% | 14.9% |
| Interquartile 75% (IQ3) | 19.4% | 37.1% |
| Interquartile Range (IQR) | 10.0% | 22.2% |
| Standard Deviation (Sample) | 8.6% | 28.1% |
| Standard Deviation (Population) | 8.5% | 27.7% |
Similar Demographics by Child Poverty Under the Age of 16
Demographics Similar to Immigrants from St. Vincent and the Grenadines by Child Poverty Under the Age of 16
In terms of child poverty under the age of 16, the demographic groups most similar to Immigrants from St. Vincent and the Grenadines are West Indian (20.1%, a difference of 0.060%), Immigrants from West Indies (20.2%, a difference of 0.14%), Immigrants from Zaire (20.1%, a difference of 0.21%), Blackfeet (20.2%, a difference of 0.26%), and Barbadian (20.0%, a difference of 0.43%).
| Demographics | Rating | Rank | Child Poverty Under the Age of 16 |
| Bangladeshis | 0.0 /100 | #278 | Tragic 19.9% |
| Sub-Saharan Africans | 0.0 /100 | #279 | Tragic 19.9% |
| Comanche | 0.0 /100 | #280 | Tragic 19.9% |
| Central Americans | 0.0 /100 | #281 | Tragic 20.0% |
| Barbadians | 0.0 /100 | #282 | Tragic 20.0% |
| Immigrants | Zaire | 0.0 /100 | #283 | Tragic 20.1% |
| West Indians | 0.0 /100 | #284 | Tragic 20.1% |
| Immigrants | St. Vincent and the Grenadines | 0.0 /100 | #285 | Tragic 20.1% |
| Immigrants | West Indies | 0.0 /100 | #286 | Tragic 20.2% |
| Blackfeet | 0.0 /100 | #287 | Tragic 20.2% |
| Immigrants | Belize | 0.0 /100 | #288 | Tragic 20.3% |
| Senegalese | 0.0 /100 | #289 | Tragic 20.4% |
| Yaqui | 0.0 /100 | #290 | Tragic 20.4% |
| Chippewa | 0.0 /100 | #291 | Tragic 20.5% |
| Immigrants | Latin America | 0.0 /100 | #292 | Tragic 20.5% |
Demographics Similar to Immigrants from Canada by Child Poverty Under the Age of 16
In terms of child poverty under the age of 16, the demographic groups most similar to Immigrants from Canada are Finnish (14.5%, a difference of 0.030%), Egyptian (14.5%, a difference of 0.030%), Immigrants from Latvia (14.5%, a difference of 0.050%), Immigrants from North Macedonia (14.5%, a difference of 0.060%), and Soviet Union (14.5%, a difference of 0.070%).
| Demographics | Rating | Rank | Child Poverty Under the Age of 16 |
| Ukrainians | 97.5 /100 | #75 | Exceptional 14.4% |
| Immigrants | Eastern Europe | 97.5 /100 | #76 | Exceptional 14.4% |
| Australians | 97.5 /100 | #77 | Exceptional 14.4% |
| Immigrants | Russia | 97.3 /100 | #78 | Exceptional 14.5% |
| Swiss | 97.3 /100 | #79 | Exceptional 14.5% |
| Immigrants | North Macedonia | 97.2 /100 | #80 | Exceptional 14.5% |
| Finns | 97.2 /100 | #81 | Exceptional 14.5% |
| Immigrants | Canada | 97.2 /100 | #82 | Exceptional 14.5% |
| Egyptians | 97.2 /100 | #83 | Exceptional 14.5% |
| Immigrants | Latvia | 97.1 /100 | #84 | Exceptional 14.5% |
| Soviet Union | 97.1 /100 | #85 | Exceptional 14.5% |
| Immigrants | Argentina | 97.1 /100 | #86 | Exceptional 14.5% |
| Taiwanese | 97.1 /100 | #87 | Exceptional 14.5% |
| Northern Europeans | 97.0 /100 | #88 | Exceptional 14.5% |
| Germans | 96.9 /100 | #89 | Exceptional 14.5% |