Immigrants from South America vs French American Indian Female Poverty Among 25-34 Year Olds
COMPARE
Immigrants from South America
French American Indian
Female Poverty Among 25-34 Year Olds
Female Poverty Among 25-34 Year Olds Comparison
Immigrants from South America
French American Indians
13.3%
FEMALE POVERTY AMONG 25-34 YEAR OLDS
66.3/ 100
METRIC RATING
160th/ 347
METRIC RANK
15.9%
FEMALE POVERTY AMONG 25-34 YEAR OLDS
0.0/ 100
METRIC RATING
278th/ 347
METRIC RANK
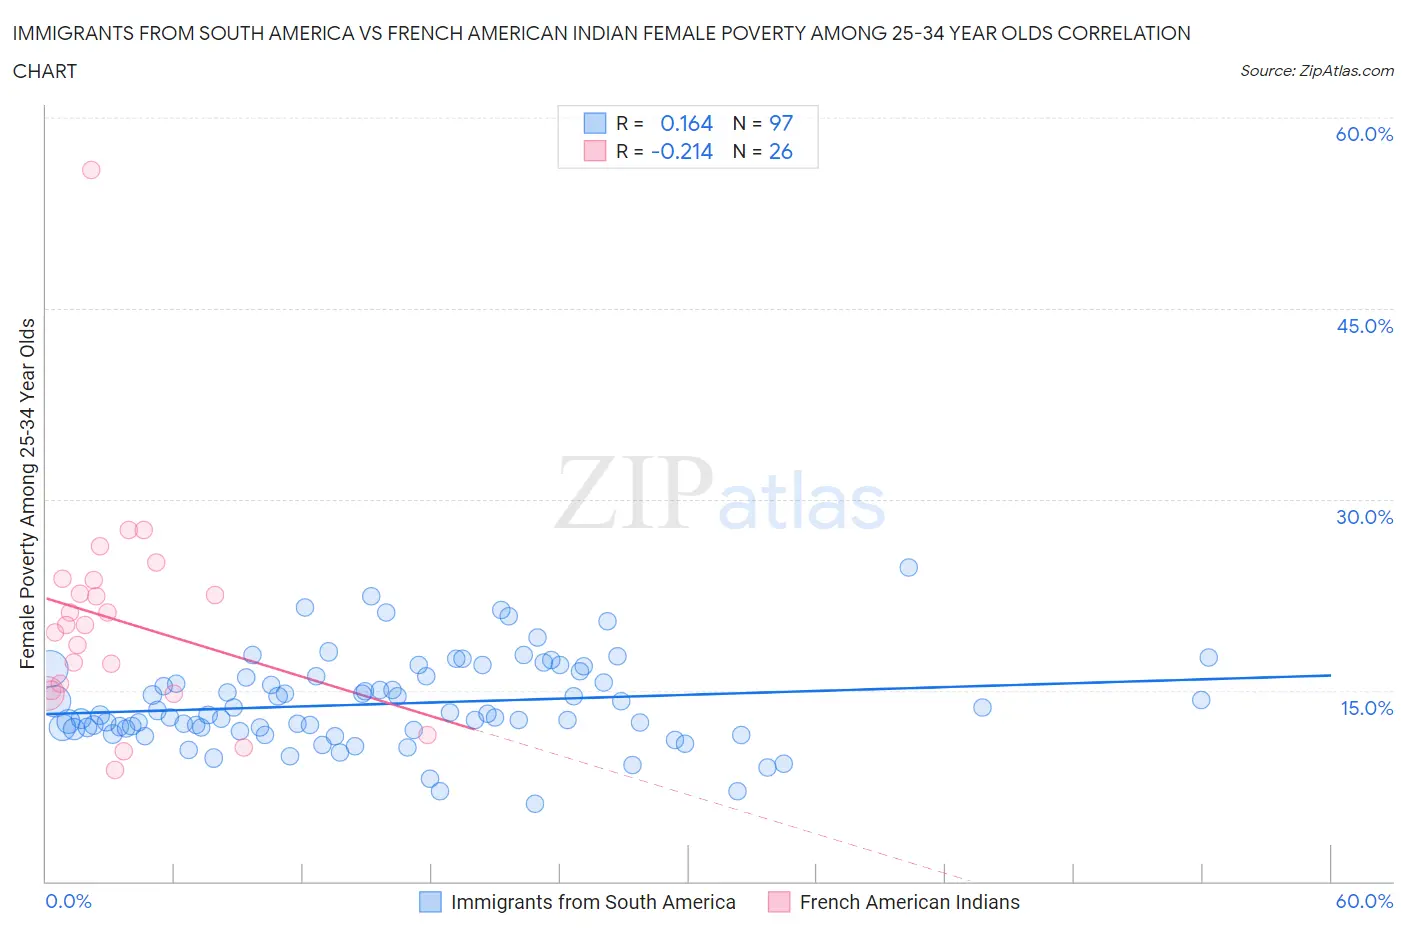
Immigrants from South America vs French American Indian Female Poverty Among 25-34 Year Olds Correlation Chart
The statistical analysis conducted on geographies consisting of 474,939,688 people shows a poor positive correlation between the proportion of Immigrants from South America and poverty level among females between the ages 25 and 34 in the United States with a correlation coefficient (R) of 0.164 and weighted average of 13.3%. Similarly, the statistical analysis conducted on geographies consisting of 131,099,782 people shows a weak negative correlation between the proportion of French American Indians and poverty level among females between the ages 25 and 34 in the United States with a correlation coefficient (R) of -0.214 and weighted average of 15.9%, a difference of 19.1%.
Female Poverty Among 25-34 Year Olds Correlation Summary
| Measurement | Immigrants from South America | French American Indian |
| Minimum | 6.1% | 8.8% |
| Maximum | 24.6% | 55.9% |
| Range | 18.5% | 47.1% |
| Mean | 13.9% | 20.5% |
| Median | 13.1% | 20.1% |
| Interquartile 25% (IQ1) | 12.0% | 15.0% |
| Interquartile 75% (IQ3) | 16.1% | 23.6% |
| Interquartile Range (IQR) | 4.1% | 8.7% |
| Standard Deviation (Sample) | 3.5% | 9.0% |
| Standard Deviation (Population) | 3.4% | 8.8% |
Similar Demographics by Female Poverty Among 25-34 Year Olds
Demographics Similar to Immigrants from South America by Female Poverty Among 25-34 Year Olds
In terms of female poverty among 25-34 year olds, the demographic groups most similar to Immigrants from South America are Uruguayan (13.3%, a difference of 0.050%), Icelander (13.3%, a difference of 0.060%), Ugandan (13.4%, a difference of 0.21%), British (13.4%, a difference of 0.26%), and Immigrants from Colombia (13.3%, a difference of 0.28%).
| Demographics | Rating | Rank | Female Poverty Among 25-34 Year Olds |
| Northern Europeans | 73.7 /100 | #153 | Good 13.2% |
| Arabs | 73.5 /100 | #154 | Good 13.2% |
| Immigrants | Sierra Leone | 72.9 /100 | #155 | Good 13.3% |
| Immigrants | Cameroon | 72.0 /100 | #156 | Good 13.3% |
| Immigrants | Western Europe | 70.3 /100 | #157 | Good 13.3% |
| Immigrants | Colombia | 69.2 /100 | #158 | Good 13.3% |
| Uruguayans | 66.9 /100 | #159 | Good 13.3% |
| Immigrants | South America | 66.3 /100 | #160 | Good 13.3% |
| Icelanders | 65.7 /100 | #161 | Good 13.3% |
| Ugandans | 64.1 /100 | #162 | Good 13.4% |
| British | 63.5 /100 | #163 | Good 13.4% |
| Swiss | 61.7 /100 | #164 | Good 13.4% |
| Basques | 59.3 /100 | #165 | Average 13.4% |
| Belgians | 58.9 /100 | #166 | Average 13.4% |
| Immigrants | Bosnia and Herzegovina | 58.6 /100 | #167 | Average 13.4% |
Demographics Similar to French American Indians by Female Poverty Among 25-34 Year Olds
In terms of female poverty among 25-34 year olds, the demographic groups most similar to French American Indians are Fijian (15.9%, a difference of 0.0%), Bangladeshi (15.9%, a difference of 0.16%), Immigrants from Micronesia (15.8%, a difference of 0.29%), Immigrants from Zaire (15.8%, a difference of 0.30%), and Immigrants from Latin America (16.0%, a difference of 0.67%).
| Demographics | Rating | Rank | Female Poverty Among 25-34 Year Olds |
| Cree | 0.1 /100 | #271 | Tragic 15.6% |
| Senegalese | 0.1 /100 | #272 | Tragic 15.6% |
| Immigrants | Nonimmigrants | 0.1 /100 | #273 | Tragic 15.6% |
| Immigrants | Caribbean | 0.0 /100 | #274 | Tragic 15.7% |
| Immigrants | Azores | 0.0 /100 | #275 | Tragic 15.8% |
| Immigrants | Zaire | 0.0 /100 | #276 | Tragic 15.8% |
| Immigrants | Micronesia | 0.0 /100 | #277 | Tragic 15.8% |
| French American Indians | 0.0 /100 | #278 | Tragic 15.9% |
| Fijians | 0.0 /100 | #279 | Tragic 15.9% |
| Bangladeshis | 0.0 /100 | #280 | Tragic 15.9% |
| Immigrants | Latin America | 0.0 /100 | #281 | Tragic 16.0% |
| Aleuts | 0.0 /100 | #282 | Tragic 16.1% |
| Bahamians | 0.0 /100 | #283 | Tragic 16.1% |
| Shoshone | 0.0 /100 | #284 | Tragic 16.2% |
| Immigrants | Bahamas | 0.0 /100 | #285 | Tragic 16.3% |