Immigrants from Sierra Leone vs Slovene Seniors Poverty Over the Age of 75
COMPARE
Immigrants from Sierra Leone
Slovene
Seniors Poverty Over the Age of 75
Seniors Poverty Over the Age of 75 Comparison
Immigrants from Sierra Leone
Slovenes
11.9%
SENIORS POVERTY OVER THE AGE OF 75
77.6/ 100
METRIC RATING
133rd/ 347
METRIC RANK
10.6%
SENIORS POVERTY OVER THE AGE OF 75
99.9/ 100
METRIC RATING
21st/ 347
METRIC RANK
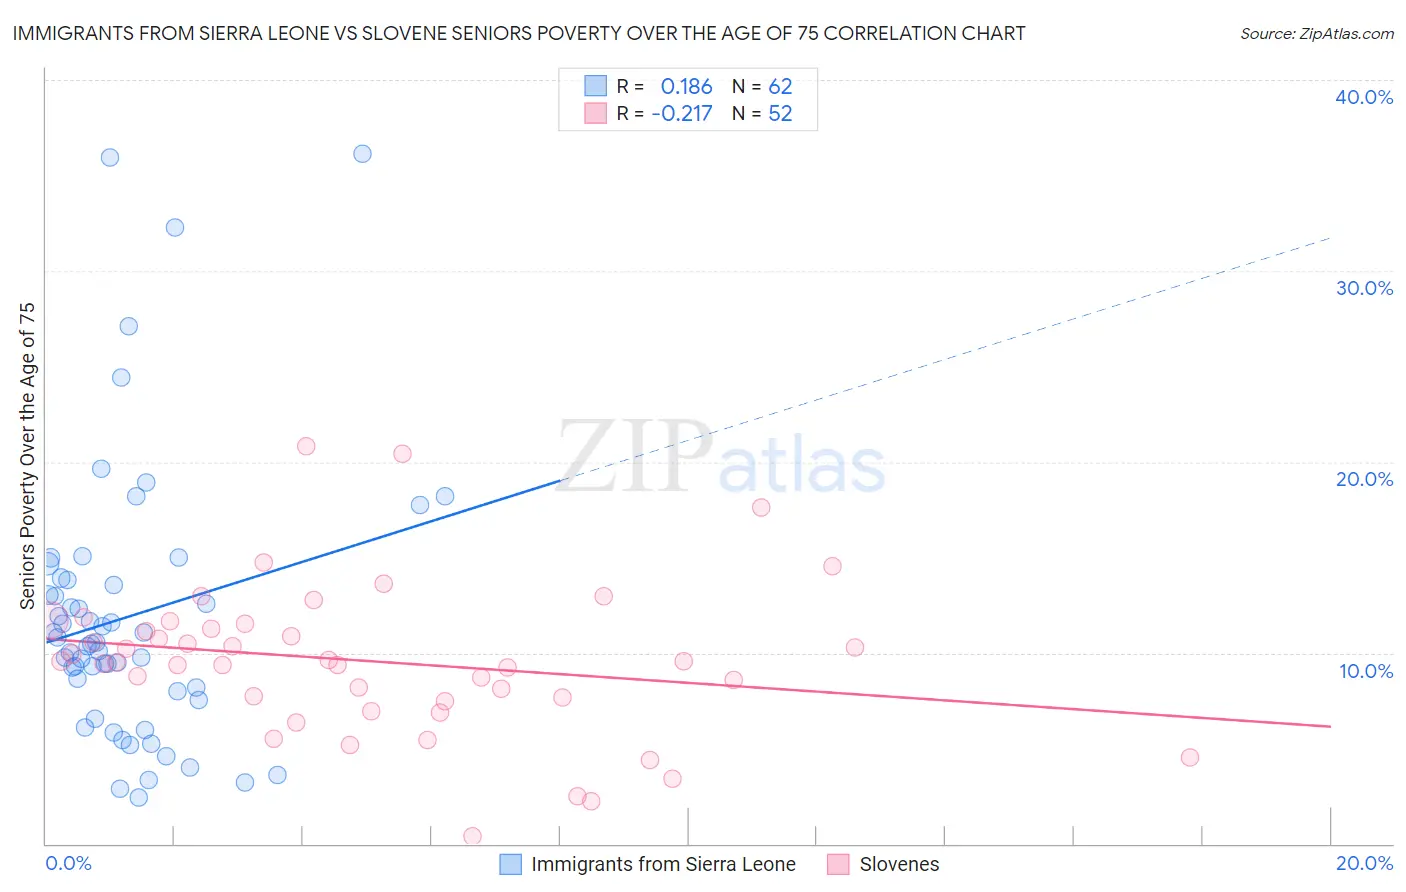
Immigrants from Sierra Leone vs Slovene Seniors Poverty Over the Age of 75 Correlation Chart
The statistical analysis conducted on geographies consisting of 101,208,220 people shows a poor positive correlation between the proportion of Immigrants from Sierra Leone and poverty level among seniors over the age of 75 in the United States with a correlation coefficient (R) of 0.186 and weighted average of 11.9%. Similarly, the statistical analysis conducted on geographies consisting of 259,031,595 people shows a weak negative correlation between the proportion of Slovenes and poverty level among seniors over the age of 75 in the United States with a correlation coefficient (R) of -0.217 and weighted average of 10.6%, a difference of 12.6%.
Seniors Poverty Over the Age of 75 Correlation Summary
| Measurement | Immigrants from Sierra Leone | Slovene |
| Minimum | 2.4% | 0.36% |
| Maximum | 36.1% | 20.8% |
| Range | 33.7% | 20.5% |
| Mean | 11.9% | 9.6% |
| Median | 10.5% | 9.5% |
| Interquartile 25% (IQ1) | 8.0% | 7.6% |
| Interquartile 75% (IQ3) | 13.8% | 11.4% |
| Interquartile Range (IQR) | 5.8% | 3.8% |
| Standard Deviation (Sample) | 7.2% | 4.0% |
| Standard Deviation (Population) | 7.1% | 4.0% |
Similar Demographics by Seniors Poverty Over the Age of 75
Demographics Similar to Immigrants from Sierra Leone by Seniors Poverty Over the Age of 75
In terms of seniors poverty over the age of 75, the demographic groups most similar to Immigrants from Sierra Leone are Ugandan (11.9%, a difference of 0.060%), Lebanese (11.9%, a difference of 0.090%), Immigrants from Ireland (11.9%, a difference of 0.16%), Immigrants from Western Europe (11.9%, a difference of 0.25%), and Immigrants from Philippines (11.9%, a difference of 0.30%).
| Demographics | Rating | Rank | Seniors Poverty Over the Age of 75 |
| Pennsylvania Germans | 83.4 /100 | #126 | Excellent 11.8% |
| Immigrants | Denmark | 82.6 /100 | #127 | Excellent 11.8% |
| Immigrants | Hungary | 81.7 /100 | #128 | Excellent 11.8% |
| Ethiopians | 80.7 /100 | #129 | Excellent 11.8% |
| Spanish | 80.5 /100 | #130 | Excellent 11.8% |
| Immigrants | Western Europe | 79.6 /100 | #131 | Good 11.9% |
| Lebanese | 78.3 /100 | #132 | Good 11.9% |
| Immigrants | Sierra Leone | 77.6 /100 | #133 | Good 11.9% |
| Ugandans | 77.1 /100 | #134 | Good 11.9% |
| Immigrants | Ireland | 76.2 /100 | #135 | Good 11.9% |
| Immigrants | Philippines | 75.0 /100 | #136 | Good 11.9% |
| Immigrants | Moldova | 74.1 /100 | #137 | Good 11.9% |
| Immigrants | Romania | 72.6 /100 | #138 | Good 11.9% |
| Immigrants | Kenya | 72.6 /100 | #139 | Good 11.9% |
| Immigrants | Pakistan | 71.9 /100 | #140 | Good 12.0% |
Demographics Similar to Slovenes by Seniors Poverty Over the Age of 75
In terms of seniors poverty over the age of 75, the demographic groups most similar to Slovenes are Czech (10.5%, a difference of 0.040%), Immigrants from Scotland (10.5%, a difference of 0.060%), Welsh (10.5%, a difference of 0.090%), Slovak (10.5%, a difference of 0.10%), and Bhutanese (10.6%, a difference of 0.26%).
| Demographics | Rating | Rank | Seniors Poverty Over the Age of 75 |
| Scottish | 99.9 /100 | #14 | Exceptional 10.5% |
| Europeans | 99.9 /100 | #15 | Exceptional 10.5% |
| Dutch | 99.9 /100 | #16 | Exceptional 10.5% |
| Slovaks | 99.9 /100 | #17 | Exceptional 10.5% |
| Welsh | 99.9 /100 | #18 | Exceptional 10.5% |
| Immigrants | Scotland | 99.9 /100 | #19 | Exceptional 10.5% |
| Czechs | 99.9 /100 | #20 | Exceptional 10.5% |
| Slovenes | 99.9 /100 | #21 | Exceptional 10.6% |
| Bhutanese | 99.8 /100 | #22 | Exceptional 10.6% |
| Lithuanians | 99.8 /100 | #23 | Exceptional 10.6% |
| Poles | 99.8 /100 | #24 | Exceptional 10.6% |
| Menominee | 99.8 /100 | #25 | Exceptional 10.6% |
| Bulgarians | 99.8 /100 | #26 | Exceptional 10.7% |
| Northern Europeans | 99.8 /100 | #27 | Exceptional 10.7% |
| Irish | 99.8 /100 | #28 | Exceptional 10.7% |