Immigrants from Sierra Leone vs German Russian Child Poverty Under the Age of 5
COMPARE
Immigrants from Sierra Leone
German Russian
Child Poverty Under the Age of 5
Child Poverty Under the Age of 5 Comparison
Immigrants from Sierra Leone
German Russians
17.3%
CHILD POVERTY UNDER THE AGE OF 5
43.6/ 100
METRIC RATING
177th/ 347
METRIC RANK
18.8%
CHILD POVERTY UNDER THE AGE OF 5
3.0/ 100
METRIC RATING
219th/ 347
METRIC RANK
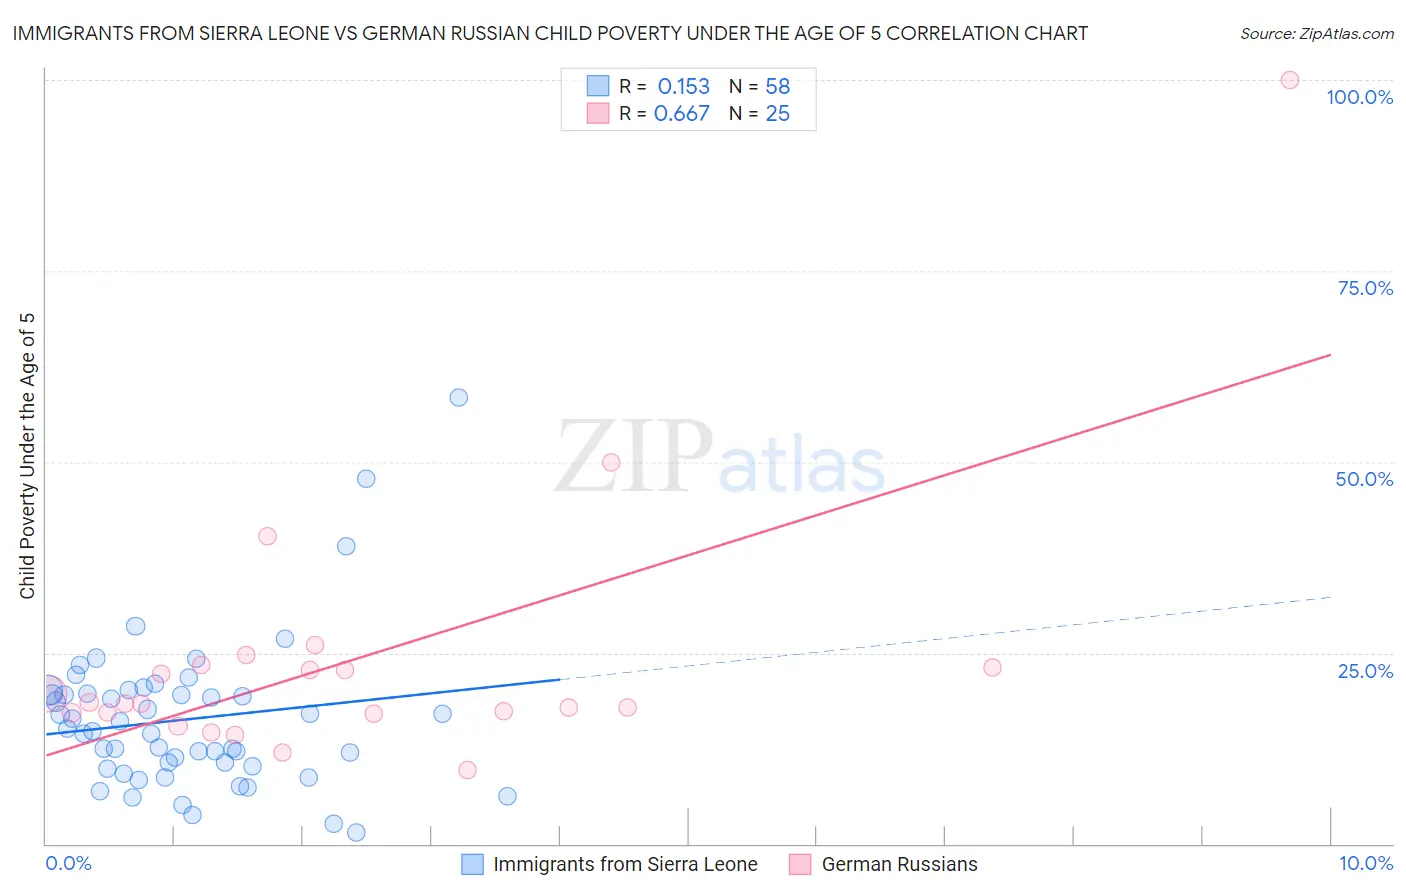
Immigrants from Sierra Leone vs German Russian Child Poverty Under the Age of 5 Correlation Chart
The statistical analysis conducted on geographies consisting of 100,756,435 people shows a poor positive correlation between the proportion of Immigrants from Sierra Leone and poverty level among children under the age of 5 in the United States with a correlation coefficient (R) of 0.153 and weighted average of 17.3%. Similarly, the statistical analysis conducted on geographies consisting of 95,587,179 people shows a significant positive correlation between the proportion of German Russians and poverty level among children under the age of 5 in the United States with a correlation coefficient (R) of 0.667 and weighted average of 18.8%, a difference of 8.3%.
Child Poverty Under the Age of 5 Correlation Summary
| Measurement | Immigrants from Sierra Leone | German Russian |
| Minimum | 1.5% | 9.7% |
| Maximum | 58.4% | 100.0% |
| Range | 57.0% | 90.3% |
| Mean | 16.3% | 24.0% |
| Median | 14.9% | 18.4% |
| Interquartile 25% (IQ1) | 10.2% | 17.1% |
| Interquartile 75% (IQ3) | 19.7% | 23.2% |
| Interquartile Range (IQR) | 9.5% | 6.2% |
| Standard Deviation (Sample) | 9.9% | 17.9% |
| Standard Deviation (Population) | 9.8% | 17.6% |
Similar Demographics by Child Poverty Under the Age of 5
Demographics Similar to Immigrants from Sierra Leone by Child Poverty Under the Age of 5
In terms of child poverty under the age of 5, the demographic groups most similar to Immigrants from Sierra Leone are Immigrants from Cameroon (17.4%, a difference of 0.10%), Immigrants from Iraq (17.3%, a difference of 0.16%), Hawaiian (17.4%, a difference of 0.23%), South American Indian (17.4%, a difference of 0.23%), and Immigrants from Germany (17.4%, a difference of 0.28%).
| Demographics | Rating | Rank | Child Poverty Under the Age of 5 |
| Immigrants | Western Asia | 59.2 /100 | #170 | Average 17.1% |
| Immigrants | Morocco | 58.9 /100 | #171 | Average 17.1% |
| Yugoslavians | 54.1 /100 | #172 | Average 17.2% |
| Welsh | 54.0 /100 | #173 | Average 17.2% |
| Immigrants | Saudi Arabia | 50.0 /100 | #174 | Average 17.2% |
| Immigrants | Lebanon | 47.6 /100 | #175 | Average 17.3% |
| Immigrants | Iraq | 45.2 /100 | #176 | Average 17.3% |
| Immigrants | Sierra Leone | 43.6 /100 | #177 | Average 17.3% |
| Immigrants | Cameroon | 42.7 /100 | #178 | Average 17.4% |
| Hawaiians | 41.5 /100 | #179 | Average 17.4% |
| South American Indians | 41.4 /100 | #180 | Average 17.4% |
| Immigrants | Germany | 41.0 /100 | #181 | Average 17.4% |
| Arabs | 40.7 /100 | #182 | Average 17.4% |
| Lebanese | 40.3 /100 | #183 | Average 17.4% |
| Immigrants | Costa Rica | 39.0 /100 | #184 | Fair 17.4% |
Demographics Similar to German Russians by Child Poverty Under the Age of 5
In terms of child poverty under the age of 5, the demographic groups most similar to German Russians are Delaware (18.7%, a difference of 0.32%), Immigrants from the Azores (18.9%, a difference of 0.36%), Immigrants from Nigeria (19.0%, a difference of 0.92%), Immigrants from Africa (18.6%, a difference of 1.1%), and Hmong (18.5%, a difference of 1.3%).
| Demographics | Rating | Rank | Child Poverty Under the Age of 5 |
| Nepalese | 8.7 /100 | #212 | Tragic 18.3% |
| Immigrants | Thailand | 8.6 /100 | #213 | Tragic 18.3% |
| Malaysians | 6.5 /100 | #214 | Tragic 18.4% |
| Immigrants | Panama | 6.0 /100 | #215 | Tragic 18.5% |
| Hmong | 5.0 /100 | #216 | Tragic 18.5% |
| Immigrants | Africa | 4.6 /100 | #217 | Tragic 18.6% |
| Delaware | 3.4 /100 | #218 | Tragic 18.7% |
| German Russians | 3.0 /100 | #219 | Tragic 18.8% |
| Immigrants | Azores | 2.6 /100 | #220 | Tragic 18.9% |
| Immigrants | Nigeria | 2.1 /100 | #221 | Tragic 19.0% |
| Alsatians | 1.7 /100 | #222 | Tragic 19.1% |
| Cubans | 1.7 /100 | #223 | Tragic 19.1% |
| Nicaraguans | 1.6 /100 | #224 | Tragic 19.1% |
| Nigerians | 1.6 /100 | #225 | Tragic 19.1% |
| Immigrants | Eritrea | 1.5 /100 | #226 | Tragic 19.1% |