Immigrants from Russia vs Palestinian Female Poverty Among 25-34 Year Olds
COMPARE
Immigrants from Russia
Palestinian
Female Poverty Among 25-34 Year Olds
Female Poverty Among 25-34 Year Olds Comparison
Immigrants from Russia
Palestinians
12.2%
FEMALE POVERTY AMONG 25-34 YEAR OLDS
99.2/ 100
METRIC RATING
64th/ 347
METRIC RANK
12.6%
FEMALE POVERTY AMONG 25-34 YEAR OLDS
96.9/ 100
METRIC RATING
93rd/ 347
METRIC RANK
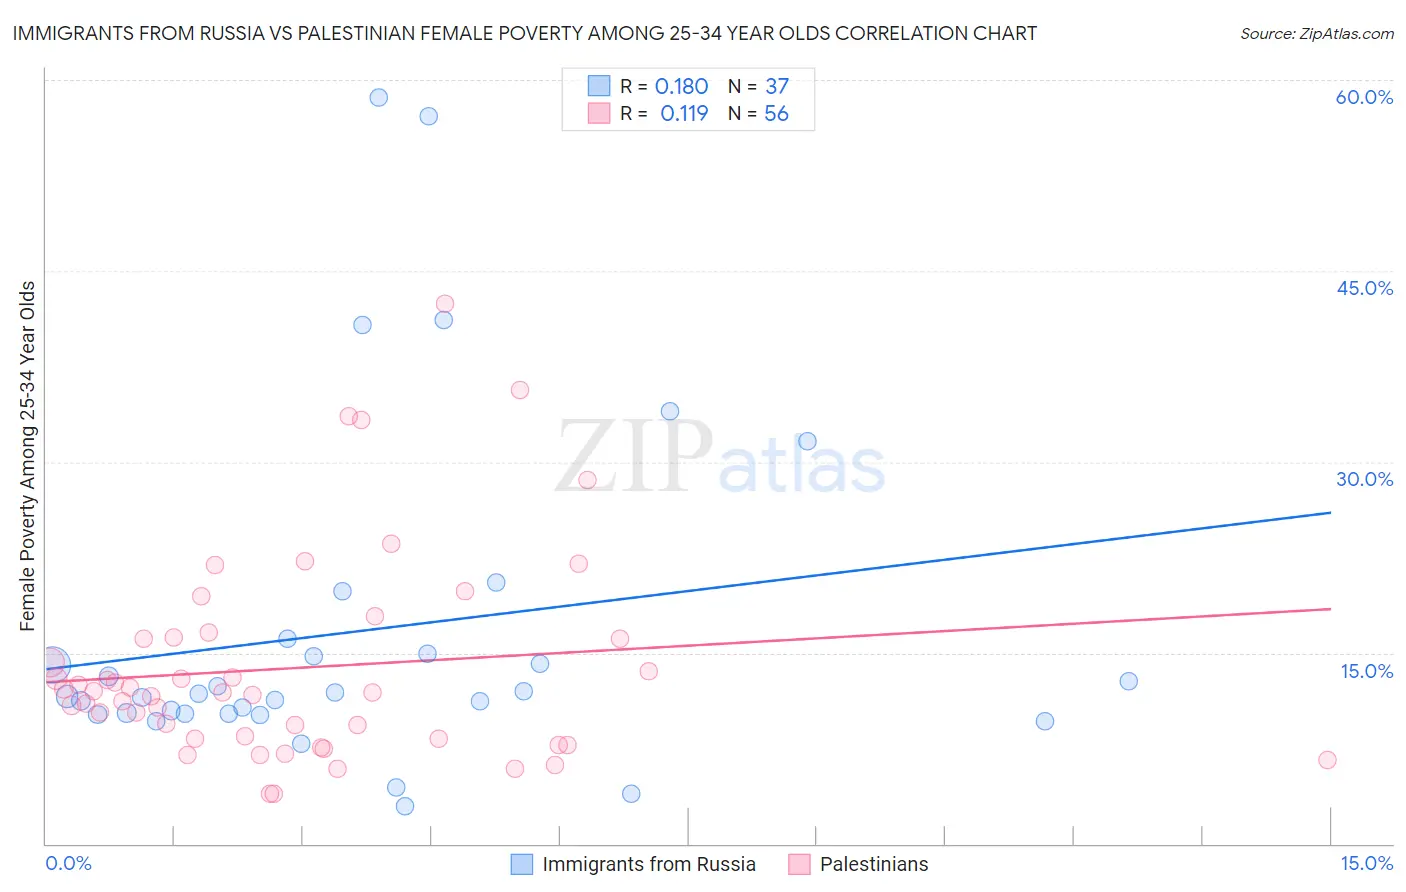
Immigrants from Russia vs Palestinian Female Poverty Among 25-34 Year Olds Correlation Chart
The statistical analysis conducted on geographies consisting of 342,245,344 people shows a poor positive correlation between the proportion of Immigrants from Russia and poverty level among females between the ages 25 and 34 in the United States with a correlation coefficient (R) of 0.180 and weighted average of 12.2%. Similarly, the statistical analysis conducted on geographies consisting of 214,977,102 people shows a poor positive correlation between the proportion of Palestinians and poverty level among females between the ages 25 and 34 in the United States with a correlation coefficient (R) of 0.119 and weighted average of 12.6%, a difference of 3.3%.
Female Poverty Among 25-34 Year Olds Correlation Summary
| Measurement | Immigrants from Russia | Palestinian |
| Minimum | 3.0% | 3.9% |
| Maximum | 58.6% | 42.4% |
| Range | 55.7% | 38.5% |
| Mean | 16.7% | 13.8% |
| Median | 11.8% | 11.9% |
| Interquartile 25% (IQ1) | 10.2% | 8.3% |
| Interquartile 75% (IQ3) | 15.5% | 16.2% |
| Interquartile Range (IQR) | 5.2% | 7.9% |
| Standard Deviation (Sample) | 13.3% | 8.2% |
| Standard Deviation (Population) | 13.1% | 8.1% |
Similar Demographics by Female Poverty Among 25-34 Year Olds
Demographics Similar to Immigrants from Russia by Female Poverty Among 25-34 Year Olds
In terms of female poverty among 25-34 year olds, the demographic groups most similar to Immigrants from Russia are Armenian (12.2%, a difference of 0.020%), Immigrants from Europe (12.2%, a difference of 0.070%), Laotian (12.2%, a difference of 0.19%), Soviet Union (12.1%, a difference of 0.24%), and Immigrants from Moldova (12.1%, a difference of 0.25%).
| Demographics | Rating | Rank | Female Poverty Among 25-34 Year Olds |
| Jordanians | 99.4 /100 | #57 | Exceptional 12.1% |
| Immigrants | Romania | 99.4 /100 | #58 | Exceptional 12.1% |
| Russians | 99.4 /100 | #59 | Exceptional 12.1% |
| Immigrants | Northern Europe | 99.4 /100 | #60 | Exceptional 12.1% |
| Immigrants | Czechoslovakia | 99.4 /100 | #61 | Exceptional 12.1% |
| Immigrants | Moldova | 99.3 /100 | #62 | Exceptional 12.1% |
| Soviet Union | 99.3 /100 | #63 | Exceptional 12.1% |
| Immigrants | Russia | 99.2 /100 | #64 | Exceptional 12.2% |
| Armenians | 99.2 /100 | #65 | Exceptional 12.2% |
| Immigrants | Europe | 99.2 /100 | #66 | Exceptional 12.2% |
| Laotians | 99.2 /100 | #67 | Exceptional 12.2% |
| Sri Lankans | 99.1 /100 | #68 | Exceptional 12.2% |
| Immigrants | Lebanon | 99.1 /100 | #69 | Exceptional 12.2% |
| Immigrants | Belgium | 99.1 /100 | #70 | Exceptional 12.2% |
| Immigrants | Scotland | 99.1 /100 | #71 | Exceptional 12.2% |
Demographics Similar to Palestinians by Female Poverty Among 25-34 Year Olds
In terms of female poverty among 25-34 year olds, the demographic groups most similar to Palestinians are Immigrants from Armenia (12.6%, a difference of 0.030%), Norwegian (12.6%, a difference of 0.050%), Immigrants from France (12.6%, a difference of 0.050%), Ukrainian (12.6%, a difference of 0.090%), and Immigrants from Zimbabwe (12.6%, a difference of 0.10%).
| Demographics | Rating | Rank | Female Poverty Among 25-34 Year Olds |
| Croatians | 97.5 /100 | #86 | Exceptional 12.5% |
| Argentineans | 97.5 /100 | #87 | Exceptional 12.5% |
| Immigrants | Austria | 97.4 /100 | #88 | Exceptional 12.5% |
| Italians | 97.2 /100 | #89 | Exceptional 12.5% |
| Immigrants | Albania | 97.1 /100 | #90 | Exceptional 12.5% |
| Norwegians | 96.9 /100 | #91 | Exceptional 12.6% |
| Immigrants | Armenia | 96.9 /100 | #92 | Exceptional 12.6% |
| Palestinians | 96.9 /100 | #93 | Exceptional 12.6% |
| Immigrants | France | 96.8 /100 | #94 | Exceptional 12.6% |
| Ukrainians | 96.7 /100 | #95 | Exceptional 12.6% |
| Immigrants | Zimbabwe | 96.7 /100 | #96 | Exceptional 12.6% |
| Immigrants | Northern Africa | 96.6 /100 | #97 | Exceptional 12.6% |
| Immigrants | Ethiopia | 96.5 /100 | #98 | Exceptional 12.6% |
| Immigrants | Argentina | 96.4 /100 | #99 | Exceptional 12.6% |
| Immigrants | Denmark | 95.7 /100 | #100 | Exceptional 12.7% |