Immigrants from Russia vs Alsatian Child Poverty Among Boys Under 16
COMPARE
Immigrants from Russia
Alsatian
Child Poverty Among Boys Under 16
Child Poverty Among Boys Under 16 Comparison
Immigrants from Russia
Alsatians
14.7%
CHILD POVERTY AMONG BOYS UNDER 16
97.7/ 100
METRIC RATING
80th/ 347
METRIC RANK
19.1%
CHILD POVERTY AMONG BOYS UNDER 16
0.3/ 100
METRIC RATING
249th/ 347
METRIC RANK
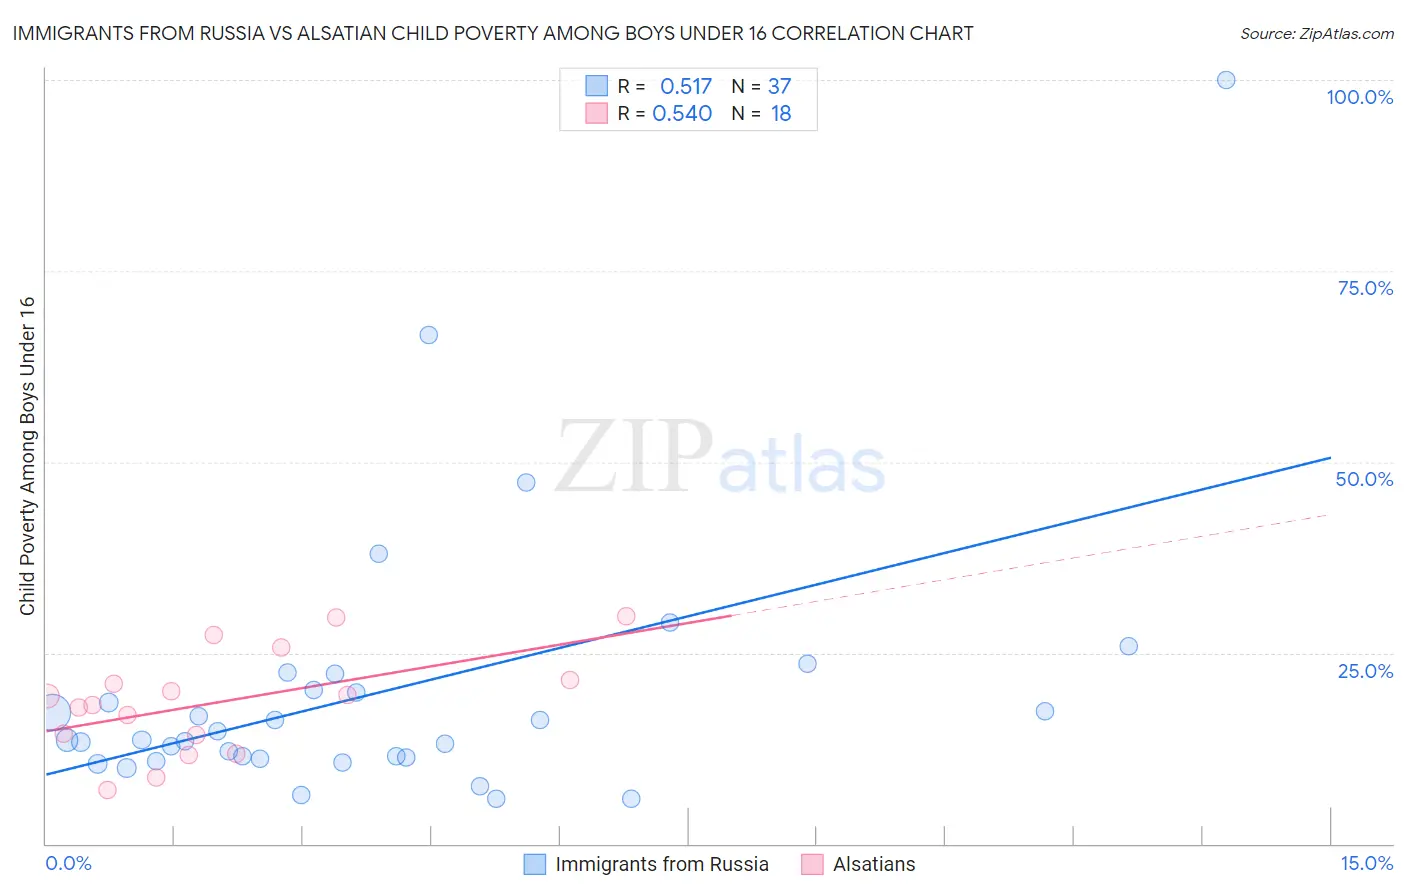
Immigrants from Russia vs Alsatian Child Poverty Among Boys Under 16 Correlation Chart
The statistical analysis conducted on geographies consisting of 341,924,588 people shows a substantial positive correlation between the proportion of Immigrants from Russia and poverty level among boys under the age of 16 in the United States with a correlation coefficient (R) of 0.517 and weighted average of 14.7%. Similarly, the statistical analysis conducted on geographies consisting of 82,051,026 people shows a substantial positive correlation between the proportion of Alsatians and poverty level among boys under the age of 16 in the United States with a correlation coefficient (R) of 0.540 and weighted average of 19.1%, a difference of 29.7%.
Child Poverty Among Boys Under 16 Correlation Summary
| Measurement | Immigrants from Russia | Alsatian |
| Minimum | 5.9% | 7.1% |
| Maximum | 100.0% | 29.7% |
| Range | 94.1% | 22.7% |
| Mean | 19.9% | 18.6% |
| Median | 13.5% | 18.7% |
| Interquartile 25% (IQ1) | 11.2% | 14.3% |
| Interquartile 75% (IQ3) | 21.2% | 21.5% |
| Interquartile Range (IQR) | 10.0% | 7.2% |
| Standard Deviation (Sample) | 18.0% | 6.7% |
| Standard Deviation (Population) | 17.7% | 6.5% |
Similar Demographics by Child Poverty Among Boys Under 16
Demographics Similar to Immigrants from Russia by Child Poverty Among Boys Under 16
In terms of child poverty among boys under 16, the demographic groups most similar to Immigrants from Russia are Immigrants from Eastern Europe (14.7%, a difference of 0.080%), Immigrants from Canada (14.7%, a difference of 0.14%), Ukrainian (14.7%, a difference of 0.16%), Egyptian (14.7%, a difference of 0.20%), and Macedonian (14.7%, a difference of 0.24%).
| Demographics | Rating | Rank | Child Poverty Among Boys Under 16 |
| Immigrants | Turkey | 98.0 /100 | #73 | Exceptional 14.6% |
| Australians | 98.0 /100 | #74 | Exceptional 14.7% |
| Immigrants | Poland | 97.9 /100 | #75 | Exceptional 14.7% |
| Immigrants | Croatia | 97.9 /100 | #76 | Exceptional 14.7% |
| Macedonians | 97.9 /100 | #77 | Exceptional 14.7% |
| Egyptians | 97.8 /100 | #78 | Exceptional 14.7% |
| Immigrants | Eastern Europe | 97.8 /100 | #79 | Exceptional 14.7% |
| Immigrants | Russia | 97.7 /100 | #80 | Exceptional 14.7% |
| Immigrants | Canada | 97.6 /100 | #81 | Exceptional 14.7% |
| Ukrainians | 97.6 /100 | #82 | Exceptional 14.7% |
| Immigrants | South Africa | 97.4 /100 | #83 | Exceptional 14.8% |
| Swiss | 97.3 /100 | #84 | Exceptional 14.8% |
| Taiwanese | 97.3 /100 | #85 | Exceptional 14.8% |
| Germans | 97.2 /100 | #86 | Exceptional 14.8% |
| Northern Europeans | 97.2 /100 | #87 | Exceptional 14.8% |
Demographics Similar to Alsatians by Child Poverty Among Boys Under 16
In terms of child poverty among boys under 16, the demographic groups most similar to Alsatians are Salvadoran (19.0%, a difference of 0.17%), Immigrants from Trinidad and Tobago (19.0%, a difference of 0.25%), Immigrants from Nicaragua (19.0%, a difference of 0.37%), Cree (19.0%, a difference of 0.57%), and Immigrants from Middle Africa (18.9%, a difference of 0.70%).
| Demographics | Rating | Rank | Child Poverty Among Boys Under 16 |
| Ghanaians | 0.5 /100 | #242 | Tragic 18.9% |
| Immigrants | Azores | 0.4 /100 | #243 | Tragic 18.9% |
| Immigrants | Middle Africa | 0.4 /100 | #244 | Tragic 18.9% |
| Cree | 0.4 /100 | #245 | Tragic 19.0% |
| Immigrants | Nicaragua | 0.4 /100 | #246 | Tragic 19.0% |
| Immigrants | Trinidad and Tobago | 0.3 /100 | #247 | Tragic 19.0% |
| Salvadorans | 0.3 /100 | #248 | Tragic 19.0% |
| Alsatians | 0.3 /100 | #249 | Tragic 19.1% |
| Immigrants | Burma/Myanmar | 0.2 /100 | #250 | Tragic 19.2% |
| French American Indians | 0.2 /100 | #251 | Tragic 19.2% |
| Immigrants | Western Africa | 0.2 /100 | #252 | Tragic 19.3% |
| Liberians | 0.2 /100 | #253 | Tragic 19.3% |
| Trinidadians and Tobagonians | 0.2 /100 | #254 | Tragic 19.3% |
| Ecuadorians | 0.2 /100 | #255 | Tragic 19.3% |
| Immigrants | Liberia | 0.2 /100 | #256 | Tragic 19.3% |