Immigrants from Romania vs Immigrants from Latin America Female Poverty Among 25-34 Year Olds
COMPARE
Immigrants from Romania
Immigrants from Latin America
Female Poverty Among 25-34 Year Olds
Female Poverty Among 25-34 Year Olds Comparison
Immigrants from Romania
Immigrants from Latin America
12.1%
FEMALE POVERTY AMONG 25-34 YEAR OLDS
99.4/ 100
METRIC RATING
58th/ 347
METRIC RANK
16.0%
FEMALE POVERTY AMONG 25-34 YEAR OLDS
0.0/ 100
METRIC RATING
281st/ 347
METRIC RANK
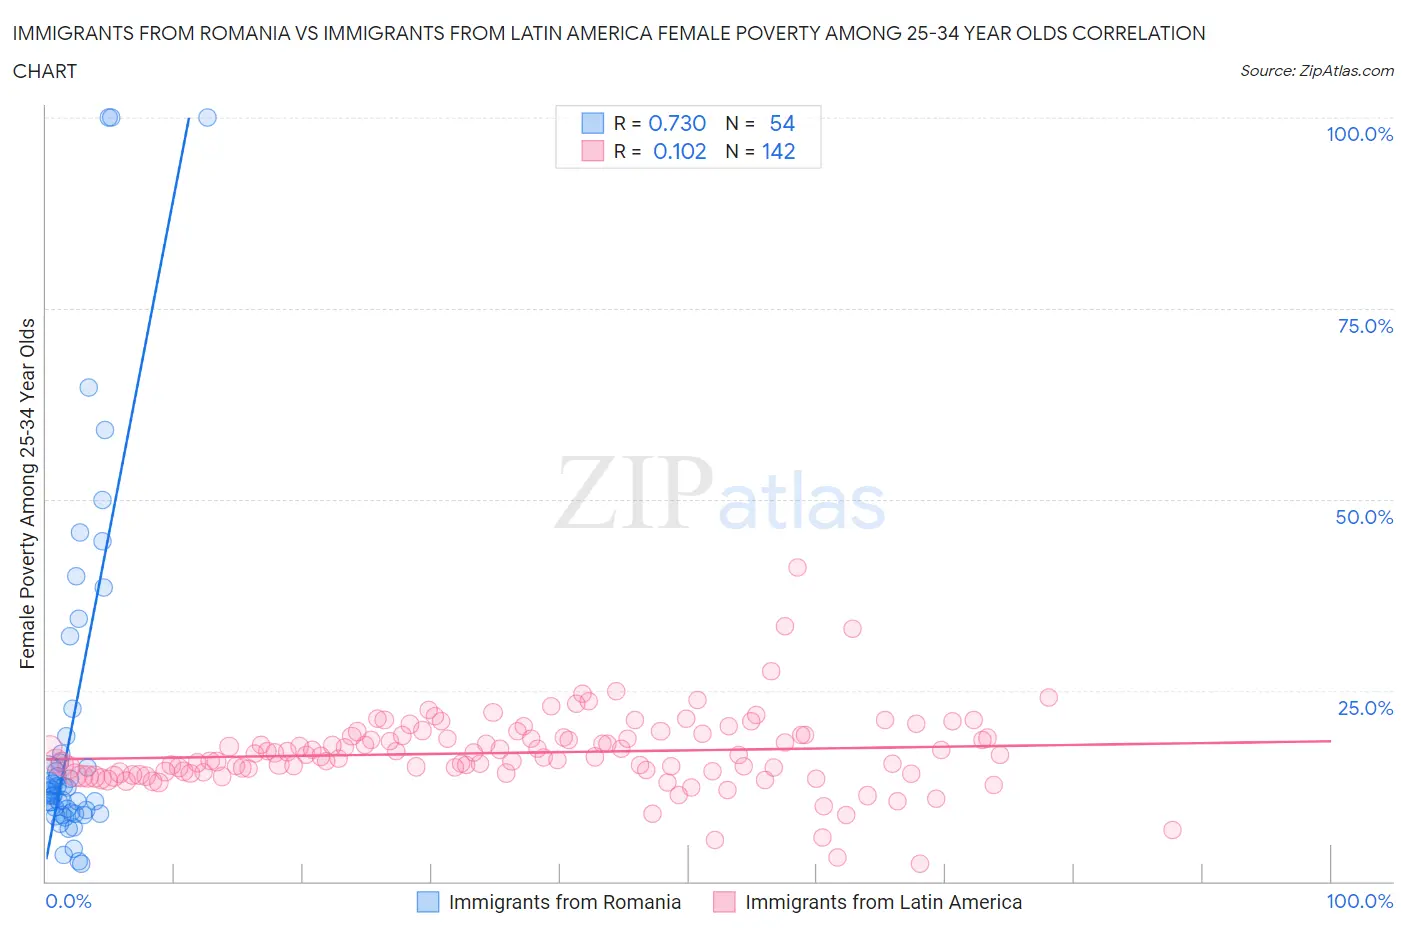
Immigrants from Romania vs Immigrants from Latin America Female Poverty Among 25-34 Year Olds Correlation Chart
The statistical analysis conducted on geographies consisting of 253,928,147 people shows a strong positive correlation between the proportion of Immigrants from Romania and poverty level among females between the ages 25 and 34 in the United States with a correlation coefficient (R) of 0.730 and weighted average of 12.1%. Similarly, the statistical analysis conducted on geographies consisting of 540,358,744 people shows a poor positive correlation between the proportion of Immigrants from Latin America and poverty level among females between the ages 25 and 34 in the United States with a correlation coefficient (R) of 0.102 and weighted average of 16.0%, a difference of 32.2%.
Female Poverty Among 25-34 Year Olds Correlation Summary
| Measurement | Immigrants from Romania | Immigrants from Latin America |
| Minimum | 2.3% | 2.2% |
| Maximum | 100.0% | 41.2% |
| Range | 97.7% | 38.9% |
| Mean | 21.5% | 16.8% |
| Median | 11.8% | 16.4% |
| Interquartile 25% (IQ1) | 9.0% | 14.2% |
| Interquartile 75% (IQ3) | 19.0% | 19.1% |
| Interquartile Range (IQR) | 10.0% | 4.9% |
| Standard Deviation (Sample) | 23.8% | 5.0% |
| Standard Deviation (Population) | 23.6% | 4.9% |
Similar Demographics by Female Poverty Among 25-34 Year Olds
Demographics Similar to Immigrants from Romania by Female Poverty Among 25-34 Year Olds
In terms of female poverty among 25-34 year olds, the demographic groups most similar to Immigrants from Romania are Russian (12.1%, a difference of 0.0%), Immigrants from Northern Europe (12.1%, a difference of 0.090%), Immigrants from Czechoslovakia (12.1%, a difference of 0.11%), Jordanian (12.1%, a difference of 0.21%), and Luxembourger (12.1%, a difference of 0.22%).
| Demographics | Rating | Rank | Female Poverty Among 25-34 Year Olds |
| Paraguayans | 99.6 /100 | #51 | Exceptional 12.0% |
| Immigrants | Eastern Europe | 99.6 /100 | #52 | Exceptional 12.0% |
| Immigrants | Israel | 99.6 /100 | #53 | Exceptional 12.0% |
| Eastern Europeans | 99.6 /100 | #54 | Exceptional 12.0% |
| Immigrants | Philippines | 99.5 /100 | #55 | Exceptional 12.0% |
| Luxembourgers | 99.5 /100 | #56 | Exceptional 12.1% |
| Jordanians | 99.4 /100 | #57 | Exceptional 12.1% |
| Immigrants | Romania | 99.4 /100 | #58 | Exceptional 12.1% |
| Russians | 99.4 /100 | #59 | Exceptional 12.1% |
| Immigrants | Northern Europe | 99.4 /100 | #60 | Exceptional 12.1% |
| Immigrants | Czechoslovakia | 99.4 /100 | #61 | Exceptional 12.1% |
| Immigrants | Moldova | 99.3 /100 | #62 | Exceptional 12.1% |
| Soviet Union | 99.3 /100 | #63 | Exceptional 12.1% |
| Immigrants | Russia | 99.2 /100 | #64 | Exceptional 12.2% |
| Armenians | 99.2 /100 | #65 | Exceptional 12.2% |
Demographics Similar to Immigrants from Latin America by Female Poverty Among 25-34 Year Olds
In terms of female poverty among 25-34 year olds, the demographic groups most similar to Immigrants from Latin America are Bangladeshi (15.9%, a difference of 0.51%), Aleut (16.1%, a difference of 0.66%), French American Indian (15.9%, a difference of 0.67%), Fijian (15.9%, a difference of 0.67%), and Bahamian (16.1%, a difference of 0.69%).
| Demographics | Rating | Rank | Female Poverty Among 25-34 Year Olds |
| Immigrants | Caribbean | 0.0 /100 | #274 | Tragic 15.7% |
| Immigrants | Azores | 0.0 /100 | #275 | Tragic 15.8% |
| Immigrants | Zaire | 0.0 /100 | #276 | Tragic 15.8% |
| Immigrants | Micronesia | 0.0 /100 | #277 | Tragic 15.8% |
| French American Indians | 0.0 /100 | #278 | Tragic 15.9% |
| Fijians | 0.0 /100 | #279 | Tragic 15.9% |
| Bangladeshis | 0.0 /100 | #280 | Tragic 15.9% |
| Immigrants | Latin America | 0.0 /100 | #281 | Tragic 16.0% |
| Aleuts | 0.0 /100 | #282 | Tragic 16.1% |
| Bahamians | 0.0 /100 | #283 | Tragic 16.1% |
| Shoshone | 0.0 /100 | #284 | Tragic 16.2% |
| Immigrants | Bahamas | 0.0 /100 | #285 | Tragic 16.3% |
| Cape Verdeans | 0.0 /100 | #286 | Tragic 16.3% |
| Americans | 0.0 /100 | #287 | Tragic 16.4% |
| Guatemalans | 0.0 /100 | #288 | Tragic 16.4% |