Immigrants from Portugal vs Immigrants from Russia Family Poverty
COMPARE
Immigrants from Portugal
Immigrants from Russia
Family Poverty
Family Poverty Comparison
Immigrants from Portugal
Immigrants from Russia
9.4%
FAMILY POVERTY
20.5/ 100
METRIC RATING
201st/ 347
METRIC RANK
8.2%
FAMILY POVERTY
93.2/ 100
METRIC RATING
117th/ 347
METRIC RANK
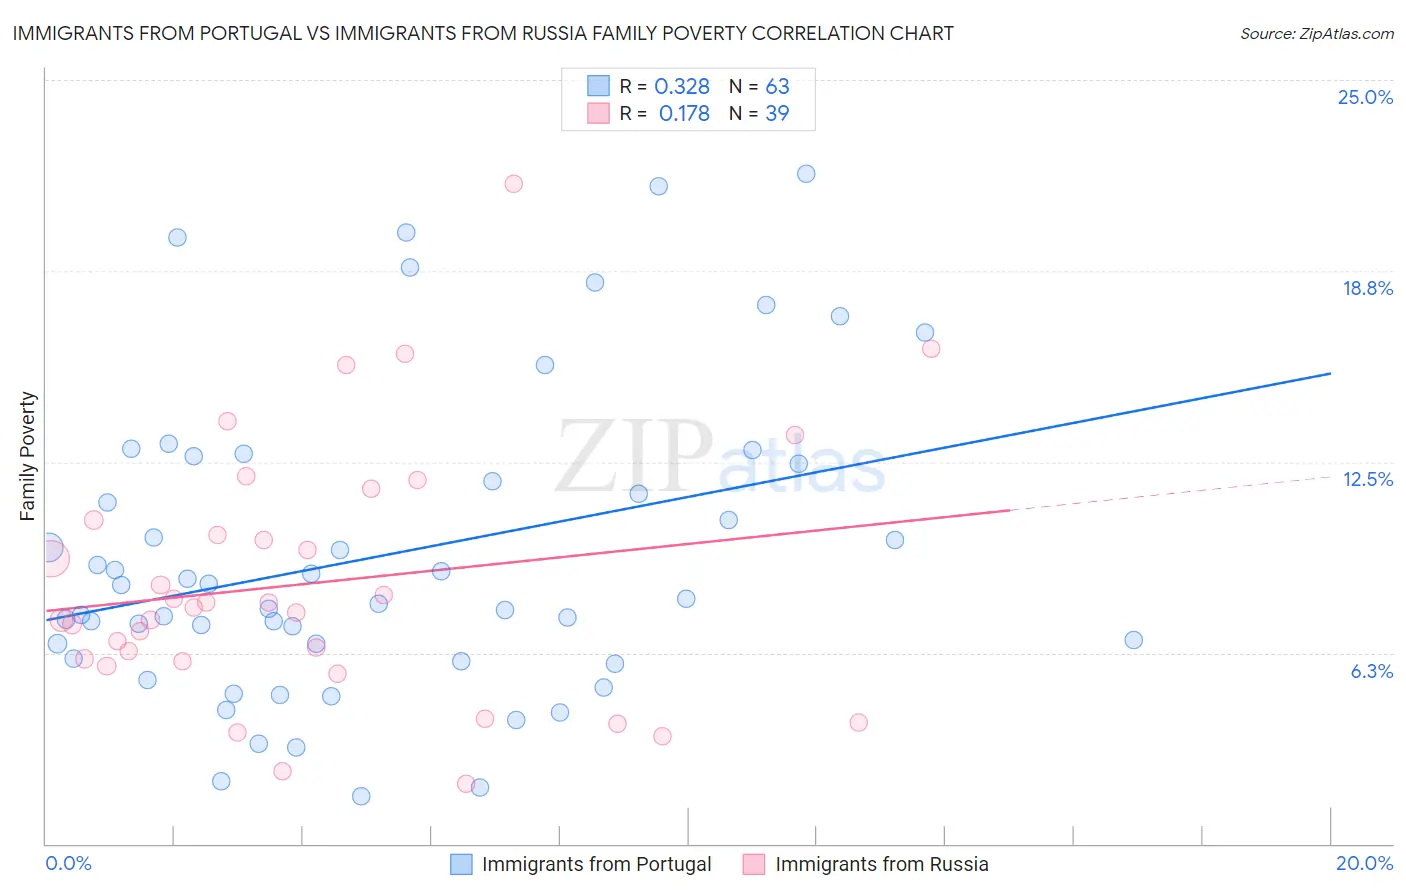
Immigrants from Portugal vs Immigrants from Russia Family Poverty Correlation Chart
The statistical analysis conducted on geographies consisting of 174,489,914 people shows a mild positive correlation between the proportion of Immigrants from Portugal and poverty level among families in the United States with a correlation coefficient (R) of 0.328 and weighted average of 9.4%. Similarly, the statistical analysis conducted on geographies consisting of 347,005,908 people shows a poor positive correlation between the proportion of Immigrants from Russia and poverty level among families in the United States with a correlation coefficient (R) of 0.178 and weighted average of 8.2%, a difference of 14.2%.
Family Poverty Correlation Summary
| Measurement | Immigrants from Portugal | Immigrants from Russia |
| Minimum | 1.6% | 1.9% |
| Maximum | 21.9% | 21.6% |
| Range | 20.4% | 19.6% |
| Mean | 9.4% | 8.5% |
| Median | 8.0% | 7.7% |
| Interquartile 25% (IQ1) | 6.1% | 6.0% |
| Interquartile 75% (IQ3) | 12.5% | 10.6% |
| Interquartile Range (IQR) | 6.4% | 4.6% |
| Standard Deviation (Sample) | 5.0% | 4.2% |
| Standard Deviation (Population) | 4.9% | 4.2% |
Similar Demographics by Family Poverty
Demographics Similar to Immigrants from Portugal by Family Poverty
In terms of family poverty, the demographic groups most similar to Immigrants from Portugal are Immigrants from Sierra Leone (9.4%, a difference of 0.17%), German Russian (9.4%, a difference of 0.21%), Immigrants from Costa Rica (9.4%, a difference of 0.23%), Immigrants from Lebanon (9.4%, a difference of 0.31%), and Spaniard (9.4%, a difference of 0.42%).
| Demographics | Rating | Rank | Family Poverty |
| South Americans | 28.1 /100 | #194 | Fair 9.3% |
| Venezuelans | 27.4 /100 | #195 | Fair 9.3% |
| Immigrants | Venezuela | 26.1 /100 | #196 | Fair 9.3% |
| Immigrants | Colombia | 24.4 /100 | #197 | Fair 9.3% |
| Iraqis | 24.2 /100 | #198 | Fair 9.3% |
| Spaniards | 22.8 /100 | #199 | Fair 9.4% |
| Immigrants | Costa Rica | 21.7 /100 | #200 | Fair 9.4% |
| Immigrants | Portugal | 20.5 /100 | #201 | Fair 9.4% |
| Immigrants | Sierra Leone | 19.6 /100 | #202 | Poor 9.4% |
| German Russians | 19.4 /100 | #203 | Poor 9.4% |
| Immigrants | Lebanon | 18.9 /100 | #204 | Poor 9.4% |
| Aleuts | 18.0 /100 | #205 | Poor 9.5% |
| Immigrants | South America | 18.0 /100 | #206 | Poor 9.5% |
| Sierra Leoneans | 15.6 /100 | #207 | Poor 9.5% |
| Immigrants | Eastern Africa | 15.1 /100 | #208 | Poor 9.5% |
Demographics Similar to Immigrants from Russia by Family Poverty
In terms of family poverty, the demographic groups most similar to Immigrants from Russia are South African (8.2%, a difference of 0.070%), Immigrants from Israel (8.2%, a difference of 0.13%), Immigrants from Western Europe (8.2%, a difference of 0.19%), French (8.3%, a difference of 0.26%), and Immigrants from Zimbabwe (8.2%, a difference of 0.47%).
| Demographics | Rating | Rank | Family Poverty |
| Romanians | 94.7 /100 | #110 | Exceptional 8.2% |
| Taiwanese | 94.6 /100 | #111 | Exceptional 8.2% |
| Immigrants | France | 94.4 /100 | #112 | Exceptional 8.2% |
| Canadians | 94.2 /100 | #113 | Exceptional 8.2% |
| Immigrants | Zimbabwe | 94.0 /100 | #114 | Exceptional 8.2% |
| Immigrants | Israel | 93.5 /100 | #115 | Exceptional 8.2% |
| South Africans | 93.4 /100 | #116 | Exceptional 8.2% |
| Immigrants | Russia | 93.2 /100 | #117 | Exceptional 8.2% |
| Immigrants | Western Europe | 92.9 /100 | #118 | Exceptional 8.2% |
| French | 92.8 /100 | #119 | Exceptional 8.3% |
| Immigrants | Egypt | 91.6 /100 | #120 | Exceptional 8.3% |
| Native Hawaiians | 91.3 /100 | #121 | Exceptional 8.3% |
| Paraguayans | 91.2 /100 | #122 | Exceptional 8.3% |
| Palestinians | 91.1 /100 | #123 | Exceptional 8.3% |
| Soviet Union | 90.8 /100 | #124 | Exceptional 8.3% |