Immigrants from Panama vs Norwegian Single Mother Poverty
COMPARE
Immigrants from Panama
Norwegian
Single Mother Poverty
Single Mother Poverty Comparison
Immigrants from Panama
Norwegians
29.8%
SINGLE MOTHER POVERTY
15.5/ 100
METRIC RATING
207th/ 347
METRIC RANK
28.4%
SINGLE MOTHER POVERTY
90.4/ 100
METRIC RATING
130th/ 347
METRIC RANK
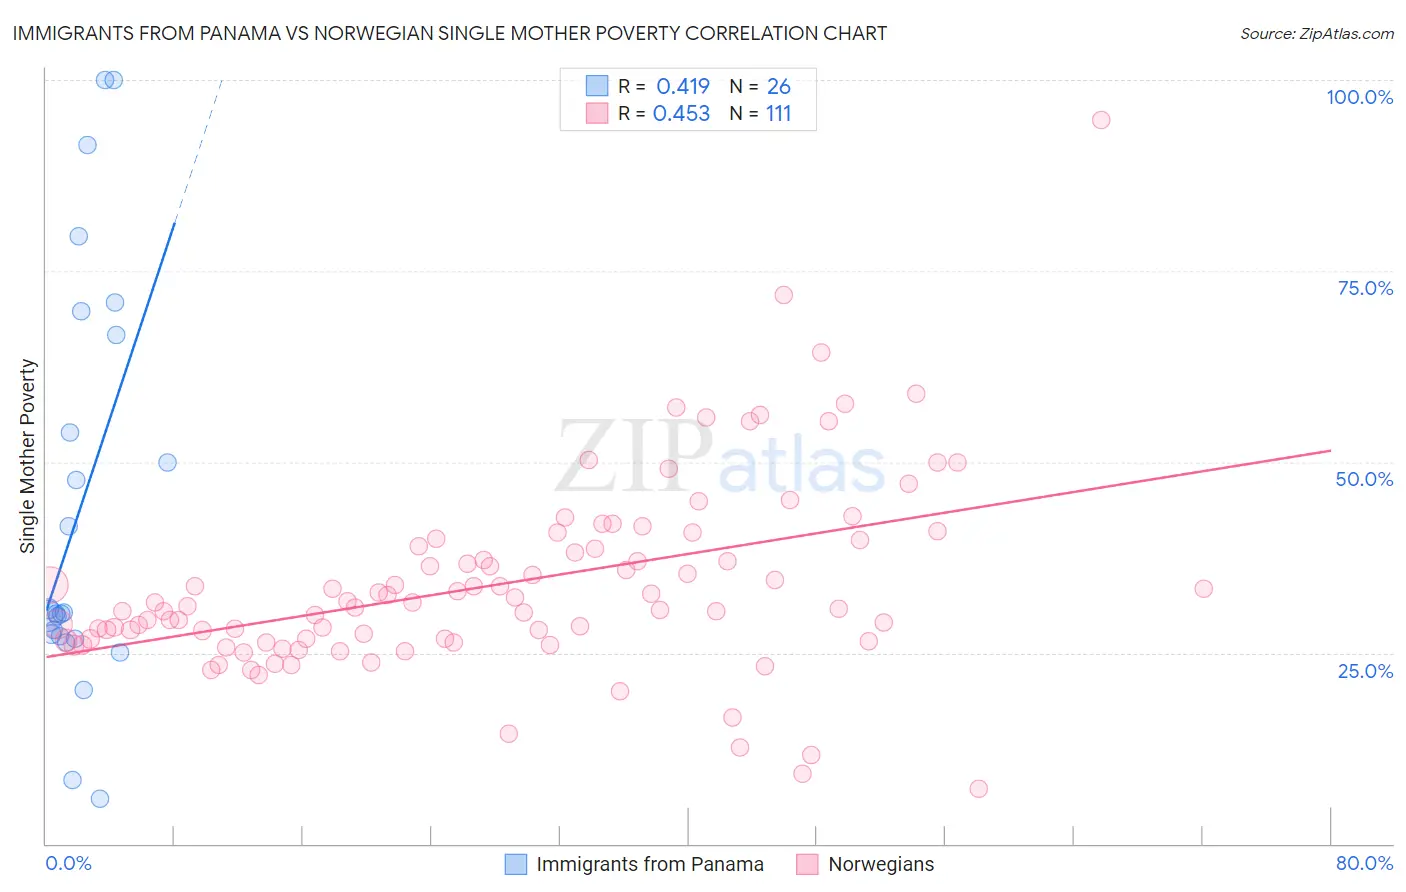
Immigrants from Panama vs Norwegian Single Mother Poverty Correlation Chart
The statistical analysis conducted on geographies consisting of 219,078,545 people shows a moderate positive correlation between the proportion of Immigrants from Panama and poverty level among single mothers in the United States with a correlation coefficient (R) of 0.419 and weighted average of 29.8%. Similarly, the statistical analysis conducted on geographies consisting of 509,575,391 people shows a moderate positive correlation between the proportion of Norwegians and poverty level among single mothers in the United States with a correlation coefficient (R) of 0.453 and weighted average of 28.4%, a difference of 4.8%.
Single Mother Poverty Correlation Summary
| Measurement | Immigrants from Panama | Norwegian |
| Minimum | 6.0% | 7.1% |
| Maximum | 100.0% | 94.7% |
| Range | 94.0% | 87.6% |
| Mean | 44.1% | 34.0% |
| Median | 30.2% | 31.1% |
| Interquartile 25% (IQ1) | 27.1% | 26.6% |
| Interquartile 75% (IQ3) | 66.7% | 38.9% |
| Interquartile Range (IQR) | 39.5% | 12.3% |
| Standard Deviation (Sample) | 26.9% | 12.6% |
| Standard Deviation (Population) | 26.4% | 12.5% |
Similar Demographics by Single Mother Poverty
Demographics Similar to Immigrants from Panama by Single Mother Poverty
In terms of single mother poverty, the demographic groups most similar to Immigrants from Panama are Immigrants from Haiti (29.7%, a difference of 0.030%), Czechoslovakian (29.7%, a difference of 0.050%), Immigrants from Guyana (29.8%, a difference of 0.070%), Immigrants (29.7%, a difference of 0.090%), and Swiss (29.7%, a difference of 0.15%).
| Demographics | Rating | Rank | Single Mother Poverty |
| Panamanians | 20.0 /100 | #200 | Fair 29.6% |
| Belgians | 18.8 /100 | #201 | Poor 29.7% |
| Malaysians | 17.4 /100 | #202 | Poor 29.7% |
| Swiss | 17.2 /100 | #203 | Poor 29.7% |
| Immigrants | Immigrants | 16.6 /100 | #204 | Poor 29.7% |
| Czechoslovakians | 16.1 /100 | #205 | Poor 29.7% |
| Immigrants | Haiti | 15.8 /100 | #206 | Poor 29.7% |
| Immigrants | Panama | 15.5 /100 | #207 | Poor 29.8% |
| Immigrants | Guyana | 14.7 /100 | #208 | Poor 29.8% |
| Irish | 13.9 /100 | #209 | Poor 29.8% |
| Haitians | 13.3 /100 | #210 | Poor 29.8% |
| Guyanese | 12.8 /100 | #211 | Poor 29.8% |
| Nicaraguans | 12.4 /100 | #212 | Poor 29.8% |
| Immigrants | Thailand | 12.0 /100 | #213 | Poor 29.9% |
| Liberians | 11.7 /100 | #214 | Poor 29.9% |
Demographics Similar to Norwegians by Single Mother Poverty
In terms of single mother poverty, the demographic groups most similar to Norwegians are South American (28.4%, a difference of 0.0%), Immigrants from Austria (28.4%, a difference of 0.010%), Immigrants from England (28.4%, a difference of 0.030%), Polish (28.4%, a difference of 0.060%), and Immigrants from Chile (28.4%, a difference of 0.070%).
| Demographics | Rating | Rank | Single Mother Poverty |
| Uruguayans | 91.7 /100 | #123 | Exceptional 28.3% |
| Immigrants | Switzerland | 91.7 /100 | #124 | Exceptional 28.3% |
| Kenyans | 90.9 /100 | #125 | Exceptional 28.4% |
| Immigrants | Chile | 90.8 /100 | #126 | Exceptional 28.4% |
| Poles | 90.8 /100 | #127 | Exceptional 28.4% |
| Immigrants | England | 90.5 /100 | #128 | Exceptional 28.4% |
| South Americans | 90.4 /100 | #129 | Exceptional 28.4% |
| Norwegians | 90.4 /100 | #130 | Exceptional 28.4% |
| Immigrants | Austria | 90.3 /100 | #131 | Exceptional 28.4% |
| Immigrants | Morocco | 89.5 /100 | #132 | Excellent 28.4% |
| Swedes | 89.4 /100 | #133 | Excellent 28.4% |
| Immigrants | Southern Europe | 89.2 /100 | #134 | Excellent 28.4% |
| Immigrants | Spain | 89.2 /100 | #135 | Excellent 28.4% |
| Native Hawaiians | 88.9 /100 | #136 | Excellent 28.4% |
| Immigrants | Canada | 88.9 /100 | #137 | Excellent 28.4% |