Immigrants from Panama vs Immigrants from Northern Africa Single Father Poverty

COMPARE

Immigrants from Panama
Race
Ancestry
AfghanAfricanAlaska NativeAlaskan AthabascanAlbanianAleutAlsatianAmericanApacheArabArapahoArgentineanArmenianAssyrian/Chaldean/SyriacAustralianAustrianBahamianBangladeshiBarbadianBasqueBelgianBelizeanBermudanBhutaneseBlackfeetBolivianBrazilianBritishBritish West IndianBulgarianBurmeseCajunCambodianCanadianCape VerdeanCarpatho RusynCelticCentral AmericanCentral American IndianCherokeeCheyenneChickasawChileanChineseChippewaChoctawColombianColvilleComancheCosta RicanCreeCreekCroatianCrowCubanCypriotCzechCzechoslovakianDanishDelawareDominicanDutchDutch West IndianEastern EuropeanEcuadorianEgyptianEnglishEstonianEthiopianEuropeanFijianFilipinoFinnishFrenchFrench American IndianFrench CanadianGermanGerman RussianGhanaianGreekGuamanian/ChamorroGuatemalanGuyaneseHaitianHmongHonduranHopiHoumaHungarianIcelanderIndian (Asian)IndonesianInupiatIranianIraqiIrishIroquoisIsraeliItalianJamaicanJapaneseJordanianKenyanKiowaKoreanLaotianLatvianLebaneseLiberianLithuanianLumbeeLuxembourgerMacedonianMalaysianMalteseMarshalleseMenomineeMexicanMexican American IndianMongolianMoroccanNative HawaiianNavajoNepaleseNew ZealanderNicaraguanNigerianNorthern EuropeanNorwegianOkinawanOsageOttawaPaiutePakistaniPalestinianPanamanianParaguayanPennsylvania GermanPeruvianPimaPolishPortuguesePotawatomiPuebloPuerto RicanPuget Sound SalishRomanianRussianSalvadoranSamoanScandinavianScotch-IrishScottishSeminoleSenegaleseSerbianShoshoneSierra LeoneanSiouxSlavicSlovakSloveneSomaliSouth AfricanSouth AmericanSouth American IndianSoviet UnionSpaniardSpanishSpanish AmericanSpanish American IndianSri LankanSubsaharan AfricanSudaneseSwedishSwissSyrianTaiwaneseThaiTlingit-HaidaTohono O'OdhamTonganTrinidadian and TobagonianTsimshianTurkishU.S. Virgin IslanderUgandanUkrainianUruguayanUteVenezuelanVietnameseWelshWest IndianYakamaYaquiYugoslavianYumanYup'ikZimbabwean
Immigration
NonimmigrantsImmigrantsAfghanistanAfricaAlbaniaArgentinaArmeniaAsiaAustraliaAustriaBahamasBangladeshBarbadosBelarusBelgiumBelizeBoliviaBosnia and HerzegovinaBrazilBulgariaBurma/MyanmarCabo VerdeCambodiaCameroonCanadaCaribbeanCentral AmericaChileChinaColombiaCongoCosta RicaCroatiaCubaCzechoslovakiaDenmarkDominicaDominican RepublicEastern AfricaEastern AsiaEastern EuropeEcuadorEgyptEl SalvadorEnglandEritreaEthiopiaEuropeFijiFranceGermanyGhanaGreeceGrenadaGuatemalaGuyanaHaitiHondurasHong KongHungaryIndiaIndonesiaIranIraqIrelandIsraelItalyJamaicaJapanJordanKazakhstanKenyaKoreaKuwaitLaosLatin AmericaLatviaLebanonLiberiaLithuaniaMalaysiaMexicoMicronesiaMiddle AfricaMoldovaMoroccoNepalNetherlandsNicaraguaNigeriaNorth AmericaNorth MacedoniaNorthern EuropeNorwayOceaniaPakistanPanamaPeruPhilippinesPolandPortugalRomaniaRussiaSaudi ArabiaScotlandSenegalSerbiaSierra LeoneSingaporeSomaliaSouth AfricaSouth AmericaSouth Central AsiaSouth Eastern AsiaSouthern EuropeSpainSri LankaSt. Vincent and the GrenadinesSudanSwedenSwitzerlandSyriaTaiwanThailandTrinidad and TobagoTurkeyUgandaUkraineUruguayUzbekistanVenezuelaVietnamWest IndiesWestern AfricaWestern AsiaWestern EuropeYemenZaireZimbabweAzores
Immigrants from Northern Africa
Race
Ancestry
AfghanAfricanAlaska NativeAlaskan AthabascanAlbanianAleutAlsatianAmericanApacheArabArapahoArgentineanArmenianAssyrian/Chaldean/SyriacAustralianAustrianBahamianBangladeshiBarbadianBasqueBelgianBelizeanBermudanBhutaneseBlackfeetBolivianBrazilianBritishBritish West IndianBulgarianBurmeseCajunCambodianCanadianCape VerdeanCarpatho RusynCelticCentral AmericanCentral American IndianCherokeeCheyenneChickasawChileanChineseChippewaChoctawColombianColvilleComancheCosta RicanCreeCreekCroatianCrowCubanCypriotCzechCzechoslovakianDanishDelawareDominicanDutchDutch West IndianEastern EuropeanEcuadorianEgyptianEnglishEstonianEthiopianEuropeanFijianFilipinoFinnishFrenchFrench American IndianFrench CanadianGermanGerman RussianGhanaianGreekGuamanian/ChamorroGuatemalanGuyaneseHaitianHmongHonduranHopiHoumaHungarianIcelanderIndian (Asian)IndonesianInupiatIranianIraqiIrishIroquoisIsraeliItalianJamaicanJapaneseJordanianKenyanKiowaKoreanLaotianLatvianLebaneseLiberianLithuanianLumbeeLuxembourgerMacedonianMalaysianMalteseMarshalleseMenomineeMexicanMexican American IndianMongolianMoroccanNative HawaiianNavajoNepaleseNew ZealanderNicaraguanNigerianNorthern EuropeanNorwegianOkinawanOsageOttawaPaiutePakistaniPalestinianPanamanianParaguayanPennsylvania GermanPeruvianPimaPolishPortuguesePotawatomiPuebloPuerto RicanPuget Sound SalishRomanianRussianSalvadoranSamoanScandinavianScotch-IrishScottishSeminoleSenegaleseSerbianShoshoneSierra LeoneanSiouxSlavicSlovakSloveneSomaliSouth AfricanSouth AmericanSouth American IndianSoviet UnionSpaniardSpanishSpanish AmericanSpanish American IndianSri LankanSubsaharan AfricanSudaneseSwedishSwissSyrianTaiwaneseThaiTlingit-HaidaTohono O'OdhamTonganTrinidadian and TobagonianTsimshianTurkishU.S. Virgin IslanderUgandanUkrainianUruguayanUteVenezuelanVietnameseWelshWest IndianYakamaYaquiYugoslavianYumanYup'ikZimbabwean
Immigration
NonimmigrantsImmigrantsAfghanistanAfricaAlbaniaArgentinaArmeniaAsiaAustraliaAustriaBahamasBangladeshBarbadosBelarusBelgiumBelizeBoliviaBosnia and HerzegovinaBrazilBulgariaBurma/MyanmarCabo VerdeCambodiaCameroonCanadaCaribbeanCentral AmericaChileChinaColombiaCongoCosta RicaCroatiaCubaCzechoslovakiaDenmarkDominicaDominican RepublicEastern AfricaEastern AsiaEastern EuropeEcuadorEgyptEl SalvadorEnglandEritreaEthiopiaEuropeFijiFranceGermanyGhanaGreeceGrenadaGuatemalaGuyanaHaitiHondurasHong KongHungaryIndiaIndonesiaIranIraqIrelandIsraelItalyJamaicaJapanJordanKazakhstanKenyaKoreaKuwaitLaosLatin AmericaLatviaLebanonLiberiaLithuaniaMalaysiaMexicoMicronesiaMiddle AfricaMoldovaMoroccoNepalNetherlandsNicaraguaNigeriaNorth AmericaNorth MacedoniaNorthern AfricaNorthern EuropeNorwayOceaniaPakistanPeruPhilippinesPolandPortugalRomaniaRussiaSaudi ArabiaScotlandSenegalSerbiaSierra LeoneSingaporeSomaliaSouth AfricaSouth AmericaSouth Central AsiaSouth Eastern AsiaSouthern EuropeSpainSri LankaSt. Vincent and the GrenadinesSudanSwedenSwitzerlandSyriaTaiwanThailandTrinidad and TobagoTurkeyUgandaUkraineUruguayUzbekistanVenezuelaVietnamWest IndiesWestern AfricaWestern AsiaWestern EuropeYemenZaireZimbabweAzores
Single Father Poverty
Income
Poverty
Unemployment
Labor Participation
Family Structure
Vehicle Availability
Education Level
Disability

Single Father Poverty Comparison

Immigrants from Panama

Immigrants from Northern Africa

Exceptional
Exceptional
15.9%
SINGLE FATHER POVERTY
91.3/ 100
METRIC RATING
124th/ 347
METRIC RANK
15.3%
SINGLE FATHER POVERTY
99.5/ 100
METRIC RATING
79th/ 347
METRIC RANK

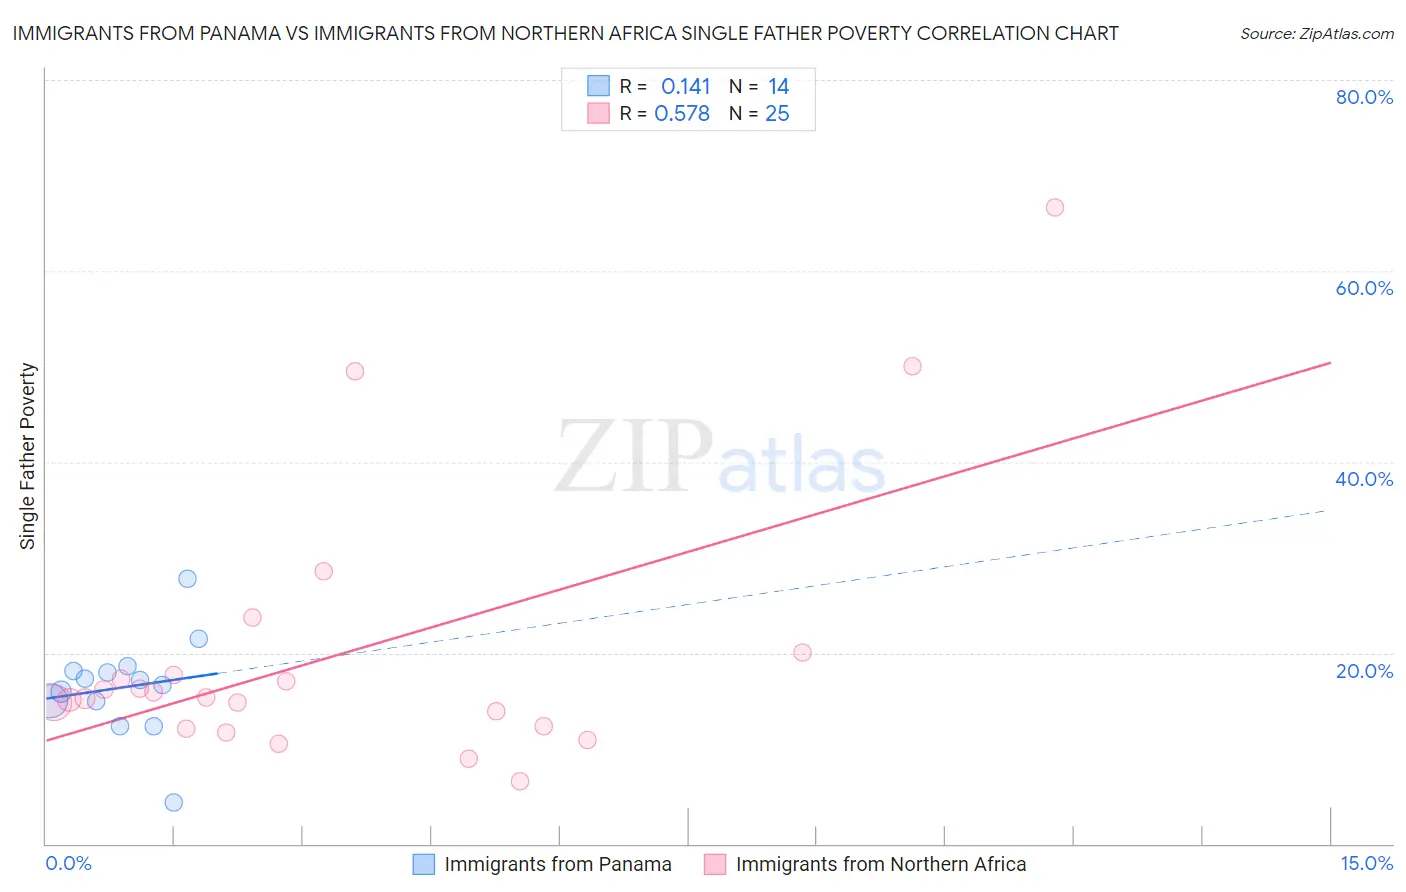
Immigrants from Panama vs Immigrants from Northern Africa Single Father Poverty Correlation Chart

The statistical analysis conducted on geographies consisting of 190,509,085 people shows a poor positive correlation between the proportion of Immigrants from Panama and poverty level among single fathers in the United States with a correlation coefficient (R) of 0.141 and weighted average of 15.9%. Similarly, the statistical analysis conducted on geographies consisting of 259,386,698 people shows a substantial positive correlation between the proportion of Immigrants from Northern Africa and poverty level among single fathers in the United States with a correlation coefficient (R) of 0.578 and weighted average of 15.3%, a difference of 3.4%.
Immigrants from Panama vs Immigrants from Northern Africa Single Father Poverty

Single Father Poverty Correlation Summary

MeasurementImmigrants from PanamaImmigrants from Northern Africa
Minimum4.3%6.6%
Maximum27.8%66.7%
Range23.5%60.1%
Mean16.4%20.0%
Median16.9%15.3%
Interquartile 25% (IQ1)15.0%12.2%
Interquartile 75% (IQ3)18.1%18.8%
Interquartile Range (IQR)3.1%6.7%
Standard Deviation (Sample)5.2%14.3%
Standard Deviation (Population)5.0%14.0%

Similar Demographics by Single Father Poverty

Demographics Similar to Immigrants from Panama by Single Father Poverty

In terms of single father poverty, the demographic groups most similar to Immigrants from Panama are Palestinian (15.9%, a difference of 0.010%), Iraqi (15.9%, a difference of 0.010%), Hmong (15.9%, a difference of 0.020%), Immigrants from Liberia (15.9%, a difference of 0.030%), and Sudanese (15.9%, a difference of 0.040%).
DemographicsRating | RankSingle Father Poverty
Immigrants | Colombia
92.6
/100
|
#117
Exceptional
15.8%
Immigrants | Eastern Europe
92.5
/100
|
#118
Exceptional
15.8%
Immigrants | Belarus
92.4
/100
|
#119
Exceptional
15.8%
Uruguayans
92.1
/100
|
#120
Exceptional
15.9%
Immigrants | Immigrants
91.9
/100
|
#121
Exceptional
15.9%
Sudanese
91.6
/100
|
#122
Exceptional
15.9%
Palestinians
91.3
/100
|
#123
Exceptional
15.9%
Immigrants | Panama
91.3
/100
|
#124
Exceptional
15.9%
Iraqis
91.2
/100
|
#125
Exceptional
15.9%
Hmong
91.1
/100
|
#126
Exceptional
15.9%
Immigrants | Liberia
91.1
/100
|
#127
Exceptional
15.9%
Immigrants | Nigeria
90.8
/100
|
#128
Exceptional
15.9%
Immigrants | West Indies
90.8
/100
|
#129
Exceptional
15.9%
Norwegians
90.2
/100
|
#130
Exceptional
15.9%
Nicaraguans
90.1
/100
|
#131
Exceptional
15.9%

Demographics Similar to Immigrants from Northern Africa by Single Father Poverty

In terms of single father poverty, the demographic groups most similar to Immigrants from Northern Africa are Tlingit-Haida (15.3%, a difference of 0.020%), Immigrants from Peru (15.3%, a difference of 0.060%), Immigrants from Japan (15.3%, a difference of 0.080%), Immigrants from Turkey (15.3%, a difference of 0.16%), and Maltese (15.3%, a difference of 0.17%).
DemographicsRating | RankSingle Father Poverty
Immigrants | Lithuania
99.6
/100
|
#72
Exceptional
15.3%
Kenyans
99.6
/100
|
#73
Exceptional
15.3%
Maltese
99.6
/100
|
#74
Exceptional
15.3%
Immigrants | Turkey
99.5
/100
|
#75
Exceptional
15.3%
Immigrants | Japan
99.5
/100
|
#76
Exceptional
15.3%
Immigrants | Peru
99.5
/100
|
#77
Exceptional
15.3%
Tlingit-Haida
99.5
/100
|
#78
Exceptional
15.3%
Immigrants | Northern Africa
99.5
/100
|
#79
Exceptional
15.3%
Armenians
99.4
/100
|
#80
Exceptional
15.4%
Immigrants | Congo
99.4
/100
|
#81
Exceptional
15.4%
Immigrants | Ukraine
99.4
/100
|
#82
Exceptional
15.4%
Chinese
99.3
/100
|
#83
Exceptional
15.4%
Peruvians
99.2
/100
|
#84
Exceptional
15.4%
Immigrants | Oceania
99.1
/100
|
#85
Exceptional
15.4%
Immigrants | Russia
99.0
/100
|
#86
Exceptional
15.5%