Immigrants from Pakistan vs Hmong Female Poverty Among 25-34 Year Olds
COMPARE
Immigrants from Pakistan
Hmong
Female Poverty Among 25-34 Year Olds
Female Poverty Among 25-34 Year Olds Comparison
Immigrants from Pakistan
Hmong
11.5%
FEMALE POVERTY AMONG 25-34 YEAR OLDS
99.9/ 100
METRIC RATING
28th/ 347
METRIC RANK
13.9%
FEMALE POVERTY AMONG 25-34 YEAR OLDS
20.3/ 100
METRIC RATING
200th/ 347
METRIC RANK
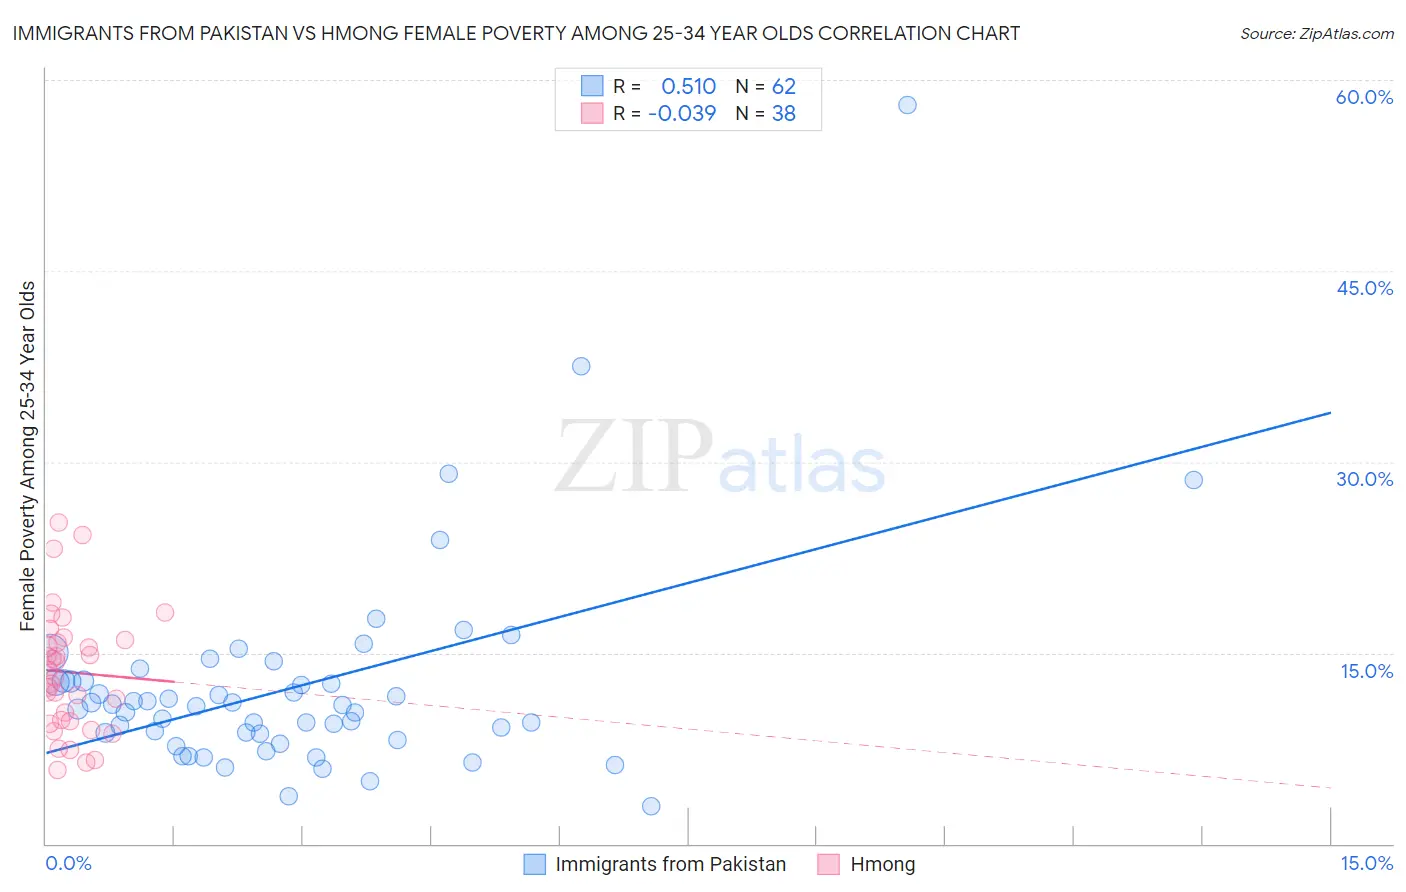
Immigrants from Pakistan vs Hmong Female Poverty Among 25-34 Year Olds Correlation Chart
The statistical analysis conducted on geographies consisting of 280,519,839 people shows a substantial positive correlation between the proportion of Immigrants from Pakistan and poverty level among females between the ages 25 and 34 in the United States with a correlation coefficient (R) of 0.510 and weighted average of 11.5%. Similarly, the statistical analysis conducted on geographies consisting of 24,665,779 people shows no correlation between the proportion of Hmong and poverty level among females between the ages 25 and 34 in the United States with a correlation coefficient (R) of -0.039 and weighted average of 13.9%, a difference of 20.7%.
Female Poverty Among 25-34 Year Olds Correlation Summary
| Measurement | Immigrants from Pakistan | Hmong |
| Minimum | 3.0% | 5.8% |
| Maximum | 58.0% | 25.3% |
| Range | 55.1% | 19.5% |
| Mean | 12.3% | 13.5% |
| Median | 10.9% | 13.3% |
| Interquartile 25% (IQ1) | 8.6% | 9.6% |
| Interquartile 75% (IQ3) | 12.8% | 16.0% |
| Interquartile Range (IQR) | 4.2% | 6.4% |
| Standard Deviation (Sample) | 8.3% | 4.8% |
| Standard Deviation (Population) | 8.3% | 4.7% |
Similar Demographics by Female Poverty Among 25-34 Year Olds
Demographics Similar to Immigrants from Pakistan by Female Poverty Among 25-34 Year Olds
In terms of female poverty among 25-34 year olds, the demographic groups most similar to Immigrants from Pakistan are Bulgarian (11.5%, a difference of 0.0%), Cypriot (11.5%, a difference of 0.030%), Immigrants from Greece (11.5%, a difference of 0.24%), Immigrants from Japan (11.6%, a difference of 0.32%), and Tongan (11.5%, a difference of 0.54%).
| Demographics | Rating | Rank | Female Poverty Among 25-34 Year Olds |
| Turks | 100.0 /100 | #21 | Exceptional 11.4% |
| Asians | 99.9 /100 | #22 | Exceptional 11.4% |
| Bolivians | 99.9 /100 | #23 | Exceptional 11.4% |
| Maltese | 99.9 /100 | #24 | Exceptional 11.4% |
| Bhutanese | 99.9 /100 | #25 | Exceptional 11.4% |
| Tongans | 99.9 /100 | #26 | Exceptional 11.5% |
| Immigrants | Greece | 99.9 /100 | #27 | Exceptional 11.5% |
| Immigrants | Pakistan | 99.9 /100 | #28 | Exceptional 11.5% |
| Bulgarians | 99.9 /100 | #29 | Exceptional 11.5% |
| Cypriots | 99.9 /100 | #30 | Exceptional 11.5% |
| Immigrants | Japan | 99.9 /100 | #31 | Exceptional 11.6% |
| Immigrants | Asia | 99.9 /100 | #32 | Exceptional 11.6% |
| Immigrants | Poland | 99.9 /100 | #33 | Exceptional 11.6% |
| Zimbabweans | 99.9 /100 | #34 | Exceptional 11.7% |
| Cambodians | 99.9 /100 | #35 | Exceptional 11.7% |
Demographics Similar to Hmong by Female Poverty Among 25-34 Year Olds
In terms of female poverty among 25-34 year olds, the demographic groups most similar to Hmong are English (13.9%, a difference of 0.020%), Immigrants from Germany (13.9%, a difference of 0.080%), Immigrants from Saudi Arabia (13.9%, a difference of 0.19%), Immigrants from Trinidad and Tobago (14.0%, a difference of 0.35%), and Scottish (13.9%, a difference of 0.39%).
| Demographics | Rating | Rank | Female Poverty Among 25-34 Year Olds |
| Immigrants | Kenya | 28.0 /100 | #193 | Fair 13.8% |
| Moroccans | 25.1 /100 | #194 | Fair 13.8% |
| Immigrants | Cambodia | 24.0 /100 | #195 | Fair 13.9% |
| Scottish | 23.6 /100 | #196 | Fair 13.9% |
| Immigrants | Saudi Arabia | 21.9 /100 | #197 | Fair 13.9% |
| Immigrants | Germany | 20.9 /100 | #198 | Fair 13.9% |
| English | 20.4 /100 | #199 | Fair 13.9% |
| Hmong | 20.3 /100 | #200 | Fair 13.9% |
| Immigrants | Trinidad and Tobago | 17.6 /100 | #201 | Poor 14.0% |
| Welsh | 17.2 /100 | #202 | Poor 14.0% |
| Immigrants | Immigrants | 14.5 /100 | #203 | Poor 14.0% |
| Hawaiians | 13.6 /100 | #204 | Poor 14.1% |
| Immigrants | Africa | 13.4 /100 | #205 | Poor 14.1% |
| Hungarians | 11.8 /100 | #206 | Poor 14.1% |
| Japanese | 11.7 /100 | #207 | Poor 14.1% |